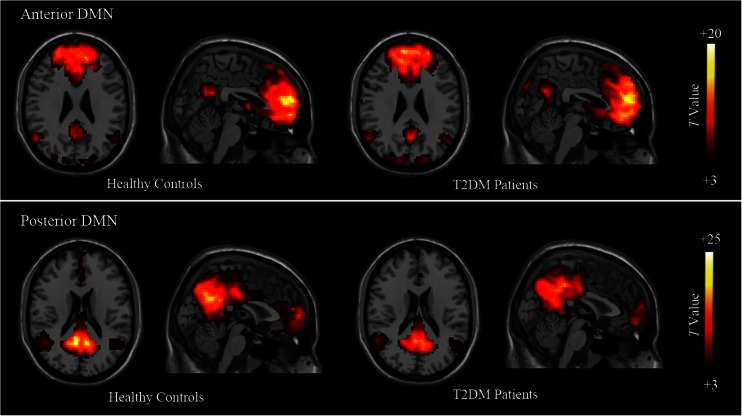
Fig. 1.
Results of one-sample t-test of the two components representing the default-mode sub-networks in patients and healthy groups (P < 0.05, FDR corrected). Representative images of the anterior default-mode network (DMN) (upper row) and the posterior DMN (lower row) in healthy controls and type 2 diabetes mellitus (T2DM) patients. Both components are displayed from the sectional and sagittal views. Colour scale represents t-values in each component (P < 0.05, FDR corrected). DMN, default-mode network; T2DM, type 2 diabetes

