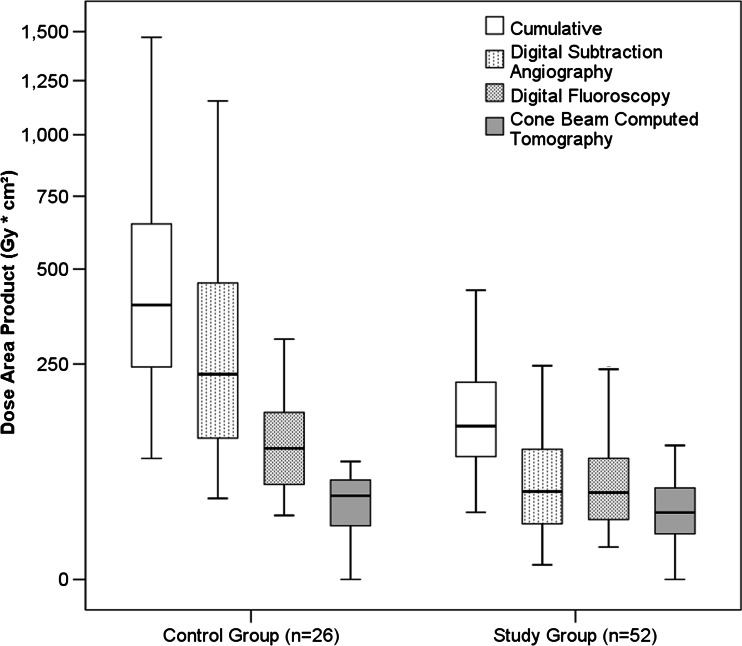
Fig. 1.
Box plot showing the distribution of radiation exposure (dose area product in Gy cm2) for the study and the control groups for the entire procedure, for digital subtraction angiography, digital fluoroscopy and cone beam CT. The plot uses power scale on the y-axis and shows the interquartile range (box), 5th and 95th percentiles (outermost bars) and the median (thick horizontal line) of the exposure distribution in each system

