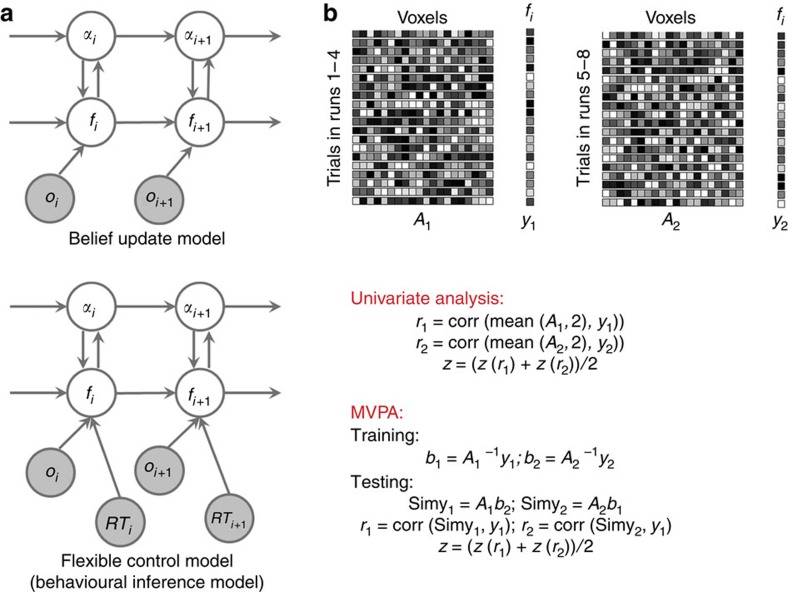
Figure 1. Model structure and schematic illustration of model-based analyses (N=21).
(a) The graphical representation of the belief update model (upper panel) and the flexible control model (lower panel). The two models use identical structure and inference algorithms except that the flexible control model also uses reaction time (RT) to update the belief of latent variables. Note that only the flexible control model was used in all analyses to account for individual difference of behaviour. The flexible control model uses four variables, flexible LR/volatility (α), predicted conflict (f), congruency (o, shown in grey indicating this variable is observable) and RT for each trial. The directed edges indicate the information flow. At a given trial, horizontal and top–down edges represent the estimation of flexible LR/volatility and predicted conflict level prior to stimulus presentation. Subsequently, the observed congruency and RT are used to update belief of latent variables in anticipation of the next trial (bottom-up edges). (b) A schematic illustration of the univariate and multivariate encoding analysis using the example model variable of predicted conflict level (see Methods for details). Importantly, prior to multivariate analysis, the searchlight mean activation vector was also regressed from each voxel's activation vector to ensure the orthogonality between the two analyses.

