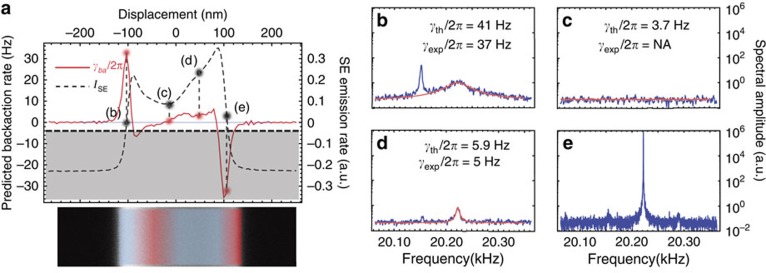
Figure 4. Transverse evolution of the e-beam backaction.
(a) Line scans of the SE emission rate (dashed, black line) and theoretically expected backaction rate Γba=Γeff–ΓM (straight, red line) obtained at the longitudinal position yp=40 μm. The grey zone represents the parametric instability region13, where the dynamical backaction cancels the intrinsic mechanical damping rate. Dots with abscissa (b–e) emphasize the values taken by ISE and Γba at the four acquisition spots. Heating and cooling regions are represented in red and blue on the SEM slice. Right panel: the SE emission rate fluctuation spectrum is measured at transverse positions xp (b–e). The straight lines are Lorentzian adjustments to the experimental data.

