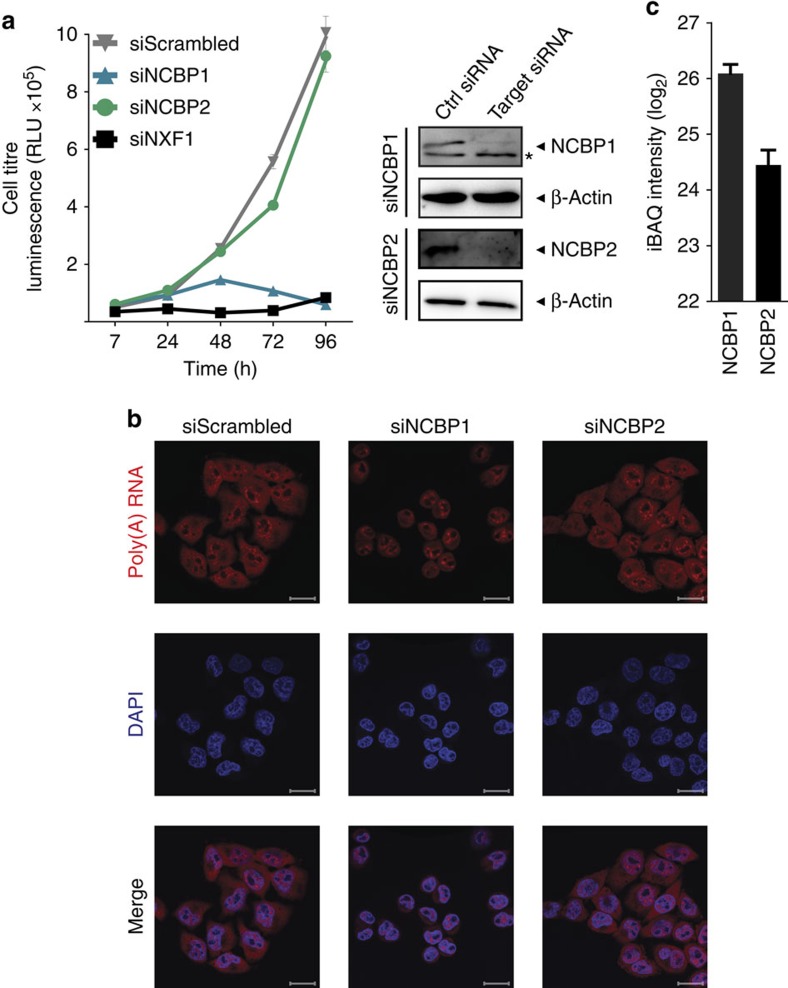
Figure 1. Cell growth and poly(A) RNA distribution after knockdown of NCBP1 or NCBP2.
(a) Growth of HeLa cells after RNAi-mediated knockdown (left panel). Cells were treated twice with siRNAs against NCBP1, NCBP2, NXF1 or non-targeting siRNA control (siScrambled), and cell titre determined by a luminescence-based cell viability assay at the indicated time points. The graph shows the mean±s.d. of two individual treatments measured in triplicates. One representative experiment of three is shown. RLU, relative light units. Knockdown efficiency of NCBP1 and NCBP2 was confirmed by western blotting against indicated proteins (right panel). Asterisk: nonspecific band. (b) Poly(A) RNA distribution in HeLa cells 48 h after repeated RNAi-mediated knockdown. HeLa cells were transfected with the indicated siRNAs, and localization of poly(A) RNA (red) was stained by RNA fluorescence in situ hybridization (RNA-FISH) using fluorescently labelled oligo (dT) as probe. DAPI (blue) was used to visualize nuclei. Shown confocal images are representative for three independent experiments. Scale bar, 20 μm. (c) Abundance of NCBP1 and NCBP2 in HeLa cells. Complete HeLa cell lysates were analysed by LC–MS/MS. Shown are average iBAQ intensities for NCBP1 and NCBP2 of 11 measurements±s.d.

