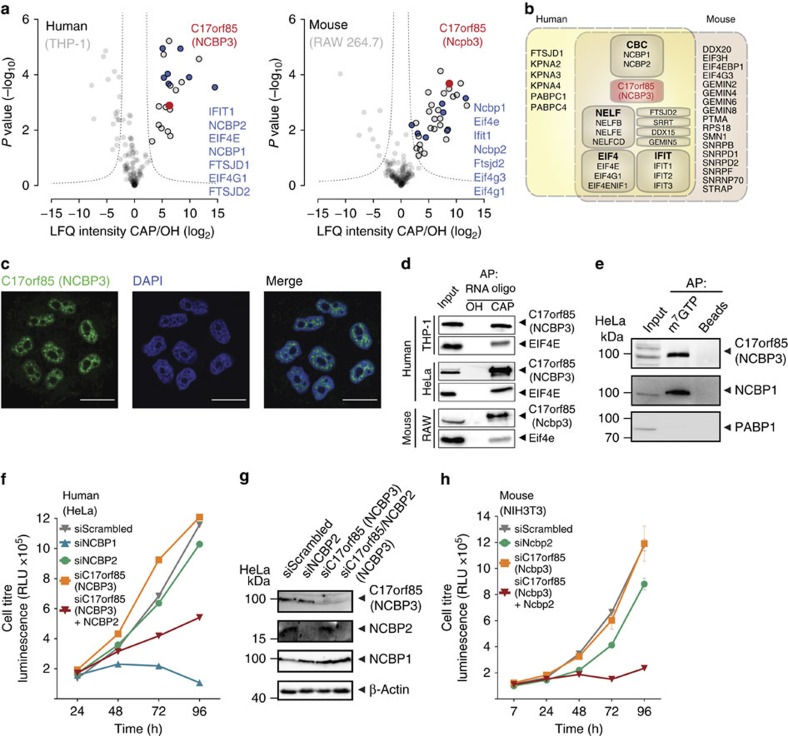
Figure 2. C17orf85/NCBP3 binds capped RNA and compensates for loss of NCBP2.
(a) Proteins enriched with 5′-capped (CAP) and uncapped (OH) RNA from THP-1 (human, left panel) and RAW 264.7 (mouse, right panel) macrophages were analysed by LC–MS/MS. Volcano plots show the average degrees of enrichment by CAP- over OH-RNA (ratio of label-free quantification (LFQ) protein intensities; x axis) and P values (t-test; y axis) for each protein. Significantly enriched proteins (circled in black) are separated from background proteins by a hyperbolic curve (dotted line). C17orf85/NCBP3 (red dot) and proteins known to bind capped RNA (blue dots) are highlighted. Three independent affinity purifications were performed for both baits. (b) Shared enrichment network. Proteins significantly enriched by CAP-RNA from either human or mouse cells (data from Fig. 1a). Proteins belonging to known protein complexes were grouped into boxes (CBC, cap-binding complex; NELF, negative elongation factor; IFIT, interferon-induced proteins with tetratricopeptide repeats; EIF4, eukaryotic translation initiation factor 4). (c) Subcellular localization of endogenous NCBP3 assessed by confocal microscopy. HeLa cells were grown on glass coverslips and stained for NCBP3 (green) and DAPI (blue). Scale bar, 20 μM. (d) Binding of endogenous C17orf85/NCBP3 to synthetic RNA oligomers (RNA oligo). Western blot analysis of precipitates after affinity purification (AP) with hydroxylated (OH) and m7G-capped (CAP) RNA oligos from murine RAW 264.7, human THP-1 and HeLa cells using antibodies against C17orf85/NCBP3 and the cap-binding control protein EIF4E. (e) Western blot analysis of m7GTP-precipitated proteins from HeLa cells detecting C17orf85/NCBP3, NCBP1 and PABP1 as control. (f,h) Growth of HeLa (f) and NIH3T3 (h) cells after RNAi-mediated knockdown. Cells were treated twice with siRNAs targeting NCBP2 or NCBP3 alone, NCBP3 together with NCBP2, or nonspecific siRNA (siScrambled) as control. The cell titre was determined by a luminescence-based cell viability assay at the indicated time points. The graph shows the mean±s.d. of two individual treatments measured in triplicates. One representative experiment of three is shown. RLU, relative light units. (g) Knockdown efficiency and specificity of NCBP2 and NCBP3 in HeLa cells was confirmed by western blotting against indicated proteins.

