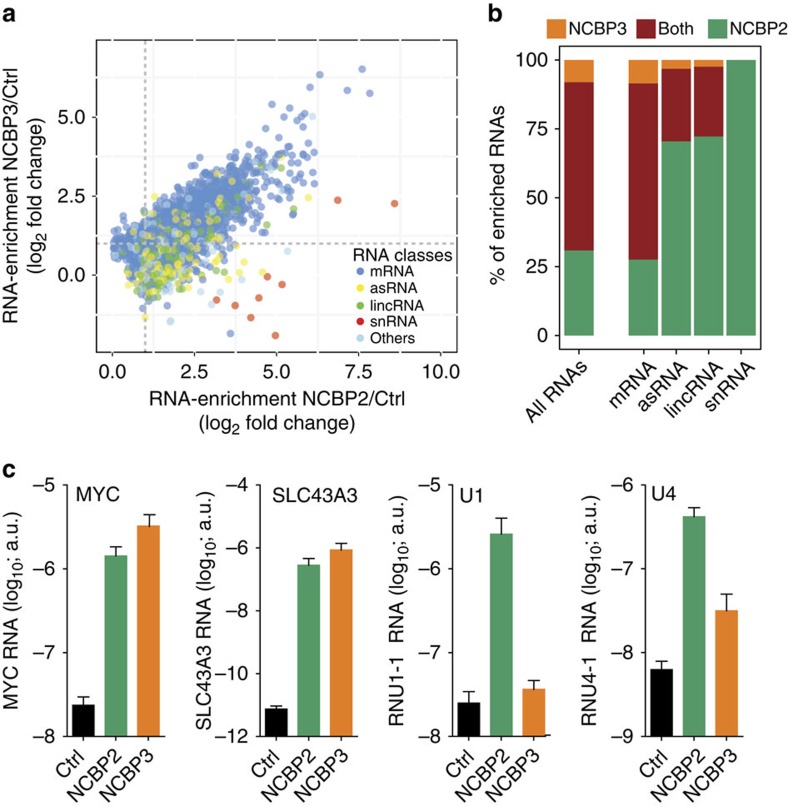
Figure 5. Global analysis of NCBP3- and NCBP2-bound RNAs.
Binding of endogenous RNA to NCBP3 and NCBP2. GFP-tagged NCBP3, NCBP2 or control protein (ctrl) stably expressed in HeLa cells were precipitated and associated RNAs were analysed by deep sequencing on the Illumina HiSeq platform (a,b) or qRT–PCR (c). All affinity purifications were performed in triplicates. (a) Scatter plot showing enrichment (FPKMbait+2/FPKMcontrol+2) of transcripts binding to NCBP2 (x axis) and NCBP3 (y axis) quantified on the gene level. RNAs are colour-coded according to their annotated RNA types in Ensembl. (b) Percentage of enriched RNA types binding to NCBP3, NCBP2 or both proteins. RNAs have been considered enriched at a fold change bait over control >2, a false discovery rate (FDR) <0.01 and a minimal read count of 10. (c) Validation of sequencing data by qRT–PCR. RNA in NCBP2, NCBP3 or control (ctrl) precipitates was amplified by qRT–PCR using specific primers for two mRNAs (MYC and SLC43A3) and two snRNAs (U1 and U4). Data represent the mean±s.d. a.u., arbitrary units.

