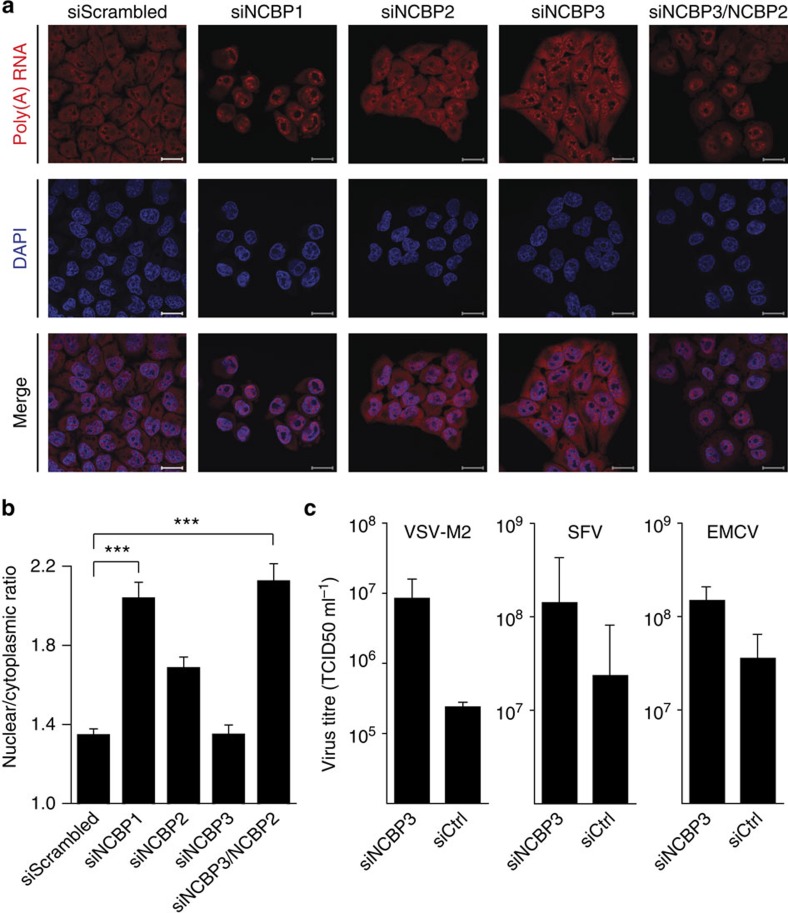
Figure 6. Functional analysis of NCBP3 at normal and virus-challenged growth conditions.
(a,b) Poly(A) RNA distribution in HeLa cells 72 h after RNAi-mediated knockdown. HeLa cells were transfected with the indicated siRNAs and localization of poly(A) RNA (red) was detected by fluorescence in situ hybridization (FISH) using fluorescently labelled oligo (dT) as probe. DAPI (blue) was used to visualize nuclei. (a) Representative images of poly(A) RNA distribution after RNAi-mediated knockdown. Scale bar, 20 μm. (b) The nuclear to cytoplasmic ratio of poly(A) RNA intensity was determined for a minimum of 125 cells per condition. Data represent the average ratio of the nuclear/cytoplasmic poly(A) RNA signal±s.d. ***P<0.001 as analysed by one-way analysis of variance statistics with Tukey's post-test. (c) Virus growth in HeLa cells after RNAi-mediated knockdown. HeLa cells were treated with siRNA against NCBP3 or nonspecific siRNA (siGFP) as control and infected with mutant vesicular stomatitis virus (VSV-M2; M51R substitution in the matrix protein), Semliki Forest virus (SFV) or encephalomyocarditis virus (EMCV). Virus titres in supernatants were determined by TCID50 24 h post infection.

