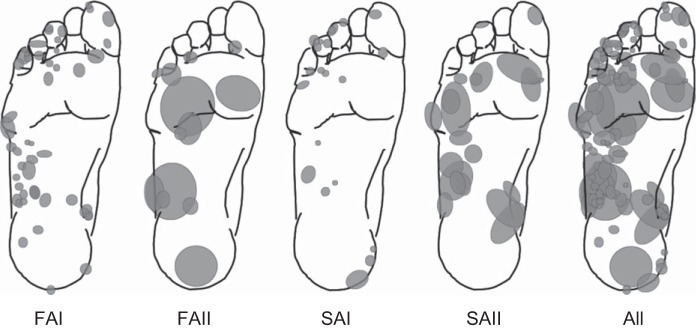
Fig. 1.

Afferent class receptive field distribution. Gray ovals indicate the relative size and location of cutaneous afferent receptive fields identified across the foot sole. FAI, fast adapting type I; FAII, fast adapting type II; SAI, slowly adapting type I; SAII, slowly adapting type II. These represent the receptive fields for all afferents included in the current study.
