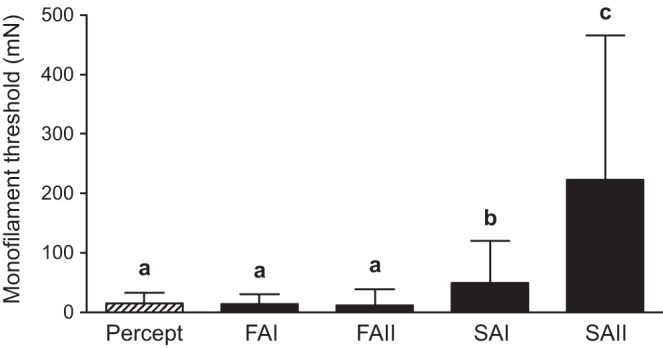
Fig. 2.

Mean (±SD) monofilament perceptual threshold (hatched bar) and afferent class firing thresholds (black bars). FAI and FAII afferent firing thresholds were significantly lower than SAI and SAII (all P values <0.001) but were not different from perceptual threshold (P > 0.05). SAI afferent firing threshold was significantly lower than SAII (P = 0.001), and both SAI and SAII afferent firing thresholds were significantly higher than perceptual threshold (SAI P = 0.004; SAII P < 0.001). The letters a, b, and c identify threshold categories that significantly differ from each other.
