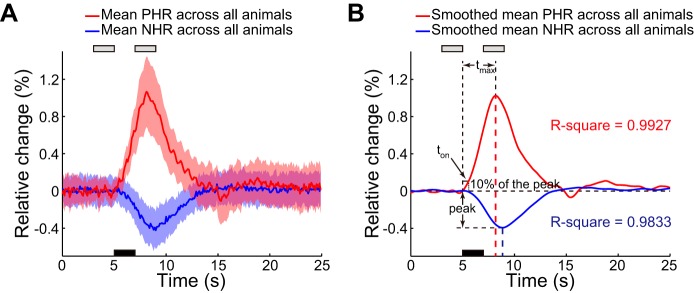
Fig. 3.

Mean PHR and NHR across all animals. A: mean Hbt values and corresponding SD in the PHR and NHR regions for 17 animals. Black bar denotes the 2-s stimulation, which was initiated at 5 s. Gray bars denote the periods before and after stimulation in which data were collected for analysis. B: corresponding spline-fitted mean Hbt signals. The characteristics of the peak response amplitude and of 2 parameters of temporal dynamics, time to peak (tmax) and onset time (ton), are shown. Dashed red and blue lines indicate peak times of mean PHR and NHR, respectively.
