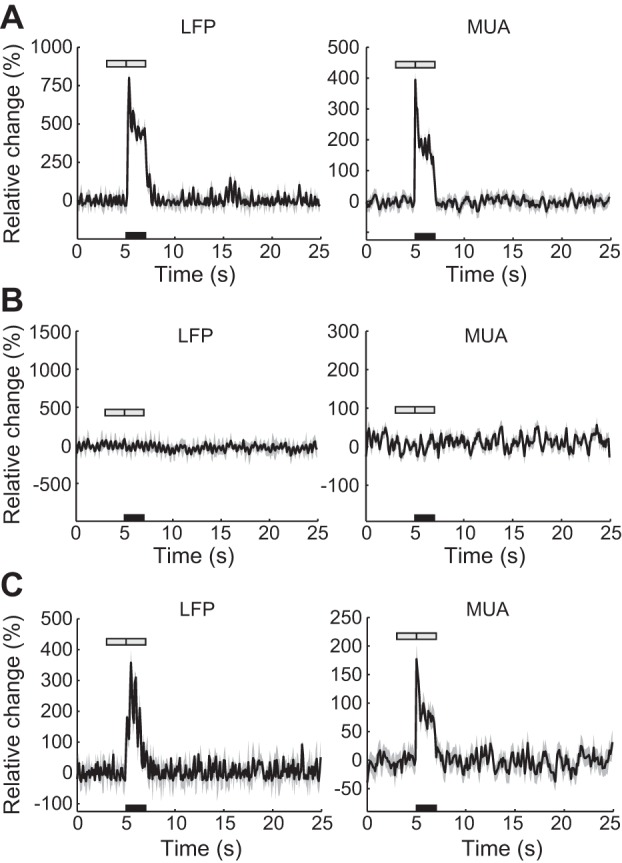
Fig. 6.

Neural activity changes in PHR and NHR regions. A: mean local field potential (LFP) and multiunit activity (MUA) recorded from a typical experiment. Data were averaged from 12 microelectrode array (MEA) channels located in the PHR region. Shading surrounding the mean time series represents the SD. Black bar denotes the 2-s stimulation, which was initiated at 5 s. Gray bars denote the periods before and after stimulation in which data were collected for analysis. B and C: same measurement as in A, except that the mean LFP and MUA were obtained from 2 representative experiments examining the NHR area. B and C show unchanged and increased neural activity, respectively; the data were averaged from 8 and 6 electrodes inserted into the NHR region, respectively.
