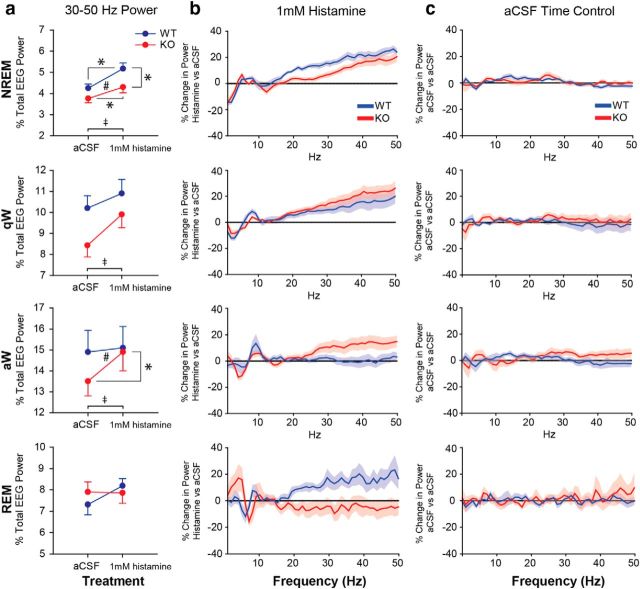
Figure 6.
TASK channels on cholinergic neurons contribute to the effects of histamine on electrocortical activity. a, Percentage of the total EEG power in the 30–50 Hz frequency band across the states of NREM sleep, quiet wakefulness (qW), active wakefulness (aW), and REM sleep. The change in 30–50 Hz EEG power from aCSF to 1 mm histamine treatment for WT (blue) and ChAT-Cre:TASKf/f (KO, red) mice is shown. Histamine promotes 30–50 Hz EEG power in WT mice, and this effect was significantly modulated by sleep–wake state in ChAT-Cre:TASKf/f mice. ‡p < 0.05, significant effect of histamine versus aCSF treatment. #p < 0.05, significant interaction between genotype and the effect of the perfusion medium. *p < 0.05, significant difference between groups using a post hoc paired t test. Values are mean ± SEM. b, c, Continuous frequency plots represent percentage changes in EEG power relative to baseline values taken during microperfusion of aCSF (horizontal line) with either histamine or during the time control period (i.e., continuous aCSF microperfusion). Plots are shown for WT and ChAT-Cre:TASKf/f mice across sleep–wake states. For histamine treatment, group sizes were n = 12 WT and n = 12 ChAT-Cre:TASKf/f mice. In the aCSF time controls, group sizes were n = 8 WT and n = 8 ChAT-Cre:TASKf/f mice. As the EEG is not affected in the time-control experiments, the shift in electrocortical activity is consistent with the action of histamine and not time-of-day effects. Values are mean ± SEM.

