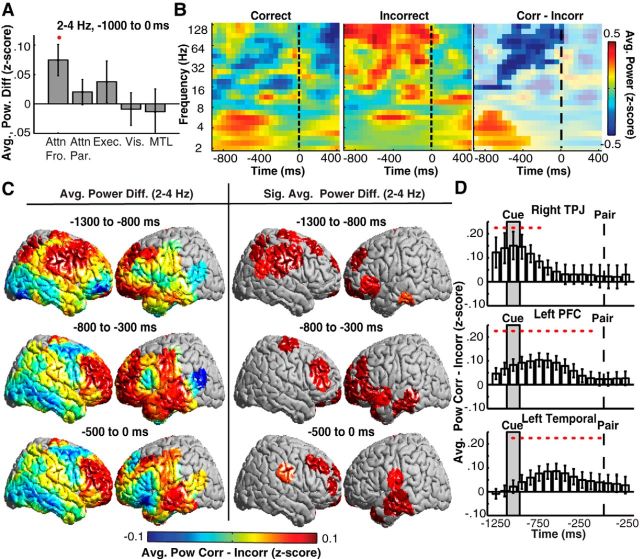
Figure 2.
Low-frequency prestimulus power changes in space and time predict memory formation across participants. A, Prestimulus differences in low-frequency (2–4 Hz) power between correct and incorrect trials across participants in frontal attention (Attn Fro.), parietal attention (Attn Par.), executive control (Exec.), visual (Vis.), and MTL regions during the prestimulus period. Regions showing significantly greater power during correct trials are indicated with a red circle (p < 0.05, permutation procedure). B, Exemplar prestimulus spectral power from a single electrode on the inferior frontal gyrus for correct (left) and incorrect (middle) trials and the difference between them (right). Significant differences between correct (Corr) and incorrect (Incorr) trials are unmasked. C, Prestimulus differences in low-frequency (2–4 Hz) power between correct and incorrect trials across the whole brain during three prestimulus temporal epochs (left). ROIs exhibiting significant (p < 0.05, corrected for multiple comparisons) differences across participants are shown (right). D, Time evolution of average power differences between correct and incorrect trials for the right TPJ, left PFC, and left temporal lobe regions that were identified using our whole-brain analysis (C). Significant temporal epochs are indicated with a red circle (p < 0.05, corrected for multiple comparisons in space and time). Word pair and cue onset are indicated by the dashed line and gray region, respectively. Error bars represent SEM across subjects.

