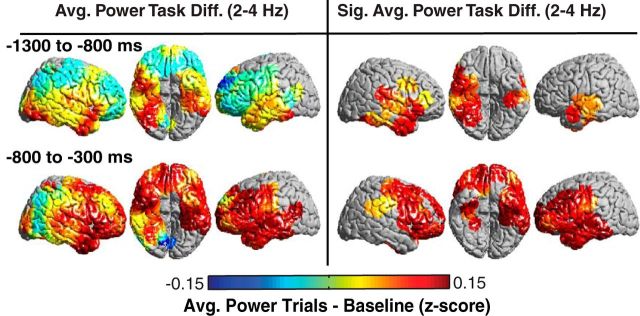
Figure 3.
Low-frequency prestimulus power predicts task responsiveness across participants. Prestimulus differences in low-frequency (2–4 Hz) power between all trials and baseline (left). ROIs exhibiting significant (p < 0.05, corrected for multiple comparisons) differences across participants are shown (right).

