Figure 4.
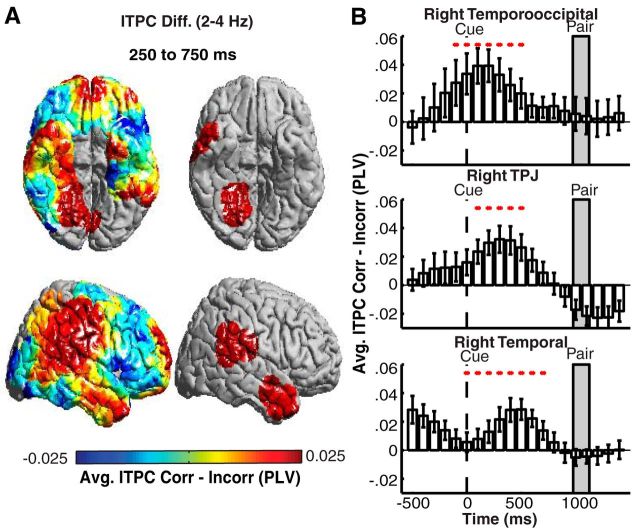
Low-frequency ITPC after cue presentation during correct trials. A, Prestimulus differences in low-frequency (2–4 Hz) ITPC between correct and incorrect trials 250–750 ms after cue presentation (left). ROIs exhibiting significant (p < 0.05, corrected for multiple comparisons) differences across participants are shown (right). B, Time evolution of average differences across participants comparing correct (Corr) and incorrect (Incorr) trials in the right TPJ, TO, and temporal lobe ROIs that showed significant differences in low-frequency (2–4 Hz) ITPC. Significant temporal epochs are indicated with a red circle (p < 0.05, corrected for multiple comparisons in space and time). Error bars represent SEM across subjects.

