
Figure 2.
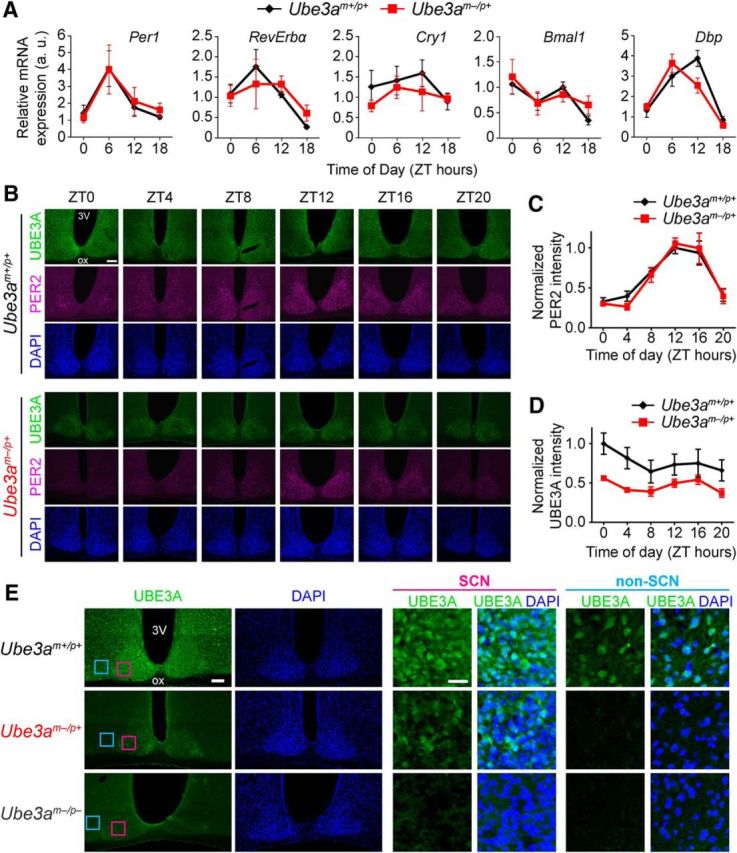
AS model mice display normal molecular rhythmicity and persistent UBE3A expression in the SCN. A, mRNA levels of the indicated genes measured by qPCR across the day in SCN. Each data point represents the mean ± SEM from four to six mice per genotype and time. B, Representative images of UBE3A and PER2 immunostaining in coronal sections through the SCN from adult Ube3am+/p+ or Ube3am−/p+ mice perfused at the indicated ZTs. DAPI was used as a nuclear counterstain. 3V, Third ventricle; ox, optic chiasm. Scale bar, 100 μm. C, Quantification of PER2 immunofluorescence intensity in SCN of adult Ube3am+/p+ or Ube3am−/p+ mice killed at 4 h intervals across the day. There was no difference between the two genotypes in rhythmic expression patterns of PER2 in the SCN (two-way ANOVA, main effect of genotype: F(1,48) = 0.113, p = 0.738; main effect of ZT: F(5,48) = 24.0, p < 0.0001). Each point represents the mean ± SEM of five mice per genotype and time, normalized to peak intensity (ZT 12, Ube3am+/p+). D, Quantification of UBE3A immunofluorescence intensity in the same sections as C. There was no significant main effect of ZT on UBE3A abundance within each genotype (two-way ANOVA: F(5,48) = 1.65, p = 0.166). However, there was an effect of genotype on UBE3A expression (two-way ANOVA: F(1,48) = 24.2, p < 0.0001). Each point represents the mean ± SEM of five mice per genotype and time, normalized to peak intensity (ZT 0, Ube3am+/p+). E, Low-magnification and high-magnification images of immunofluorescent staining for UBE3A and DAPI in coronal sections through the SCN from adult Ube3am+/p+, Ube3am−/p+, and Ube3am−/p− mice. High-magnification images show expression of UBE3A in a subset of SCN neurons (pink boxes in left images), but not in a neighboring region of non-SCN hypothalamus (blue boxes) in Ube3am−/p+ mice. DAPI counterstain demarcates the dense population of cells that make up the SCN. Scale bars: left, 100 μm; right, 25 μm.