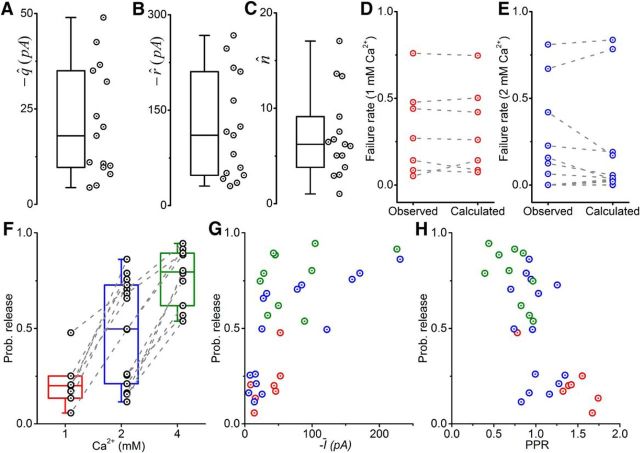
Figure 3.
BQA demonstrates that the large magnitude of responses from Renshaw cells to inputs from single motoneurons is a result of a high probability of release from multiple release sites. Box-and-whiskers are shown for the quantal size (A; q̂), maximal response (B; r̂), and number of release sites (C; n̂). For recordings in which failures were observed, there were no significant differences in the observed failure rates and those calculated from the BQA estimates at 1 mm (D) and 2 mm (E) calcium concentrations. F, Probabilities of release at 1 mm (red), 2 mm (blue), and 4 mm (green). The probabilities of release are plotted as scatters against the mean current (G; Ī) and PPR (H).

