
Figure 4.
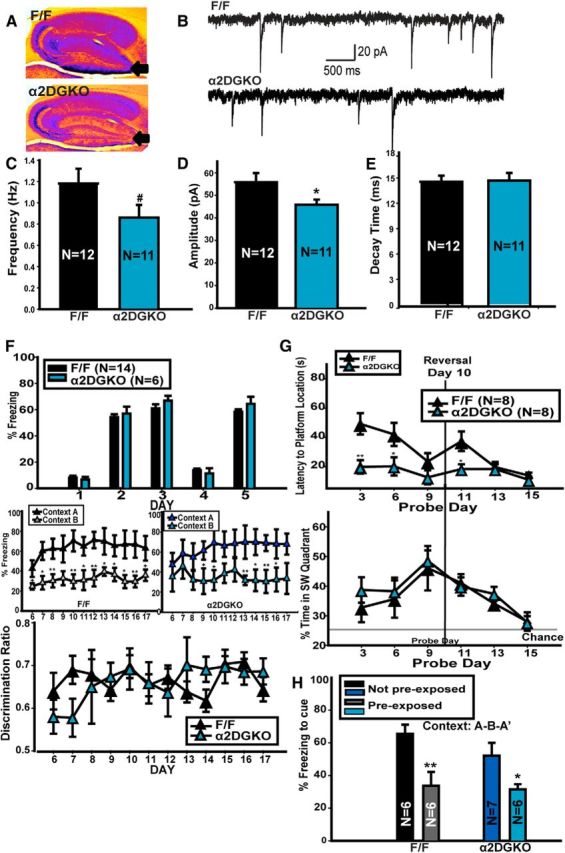
A, False color image of DAB staining for α2-GABAARs in F/F and α2DGKO mice. Cool colors represent denser staining. B, Representative traces recorded from slices from F/F control (top) and α2DGKO (bottom) mice. Frequency (C), amplitude (D), and decay time (E) of mIPSCs recorded in slices from F/F and α2DGKO mice. F, Context discrimination in F/F and α2DGKO mice. G, MWM in F/F and α2DGKO mice. H, Latent inhibition in F/F and α2DGKO mice. *p < 0.05, **p < 0.01, #p < 0.08.