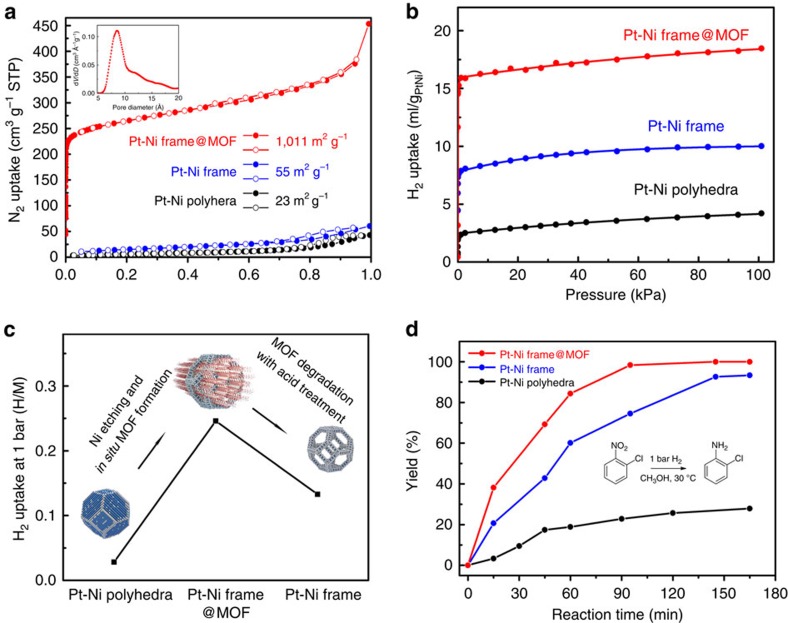
Figure 3. Gas-sorption properties and catalytic hydrogenation efficiencies.
(a) Nitrogen-sorption isotherms at 77 K up to 1 bar. The filled and open symbols represent adsorption and desorption curves, respectively (b) H2 adsorption isotherms at 273 K up to 1 bar normalized by the mass of metal. Detailed interpretation of the calculation process is available in the ESI. (c) Comparison of H2 uptake at 273 K and 1 bar among three catalysts. (d) Yield (%) of 2-chloroaniline as a function of time in the selective hydrogenation of 1-chloro-2-nitrobenzene with Pt–Ni polyhedra, Pt–Ni frame and Pt–Ni frame @ MOF.

