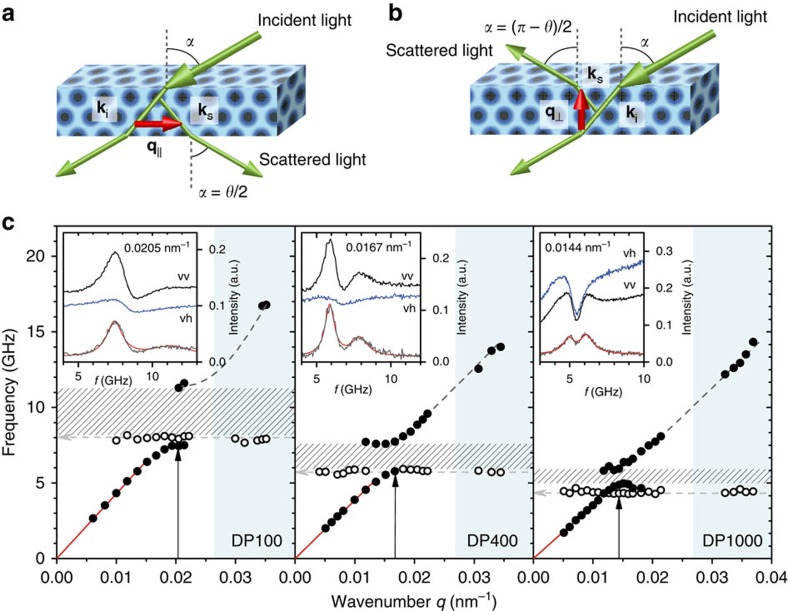
Figure 3. Recording the phononic band diagram.
(a,b) Brillouin light scattering geometries probing phonon propagation along the wave vector q=ks–ki, with ks, ki being, respectively, the incident laser and scattered light wave vector. The direction of q is selected either in-plane ((a) transmission geometry) or normal to the plane ((b) reflection geometry). In the transmission geometry, the magnitude q is tuned by varying the scattering angle θ and is independent of the refractive index of the medium. (c) Experimental dispersion relation (frequency versus wavenumber q) for DP100, DP400 and DP1000 samples, obtained from the corresponding deducted BLS spectra (insets) recorded at a given q (vertical arrows) and fitted as a sum of Lorentzian shapes (red lines). The deducted isotropic (grey) spectra is the difference between the intensities recorded in vv (black) and vh (blue) polarizations, Ivv-xIvh, with x being a variable factor between 0.7 and 4/3. In each plot, a clear band gap region (patterned area) and a localized mode (open circles) are observed. The red lines in the low q regime represent the effective medium acoustic mode; the dashed grey lines in the high-frequency branch are guides to the eye, connecting the data acquired with q perpendicular to the substrate plane (blue shaded area) using the reflection geometry in a. The frequency of the flat mode is indicated by a grey dashed arrow, and wavenumber number of the gap opening is marked with a black solid arrow, with an error of ∼0.002 nm−1.

