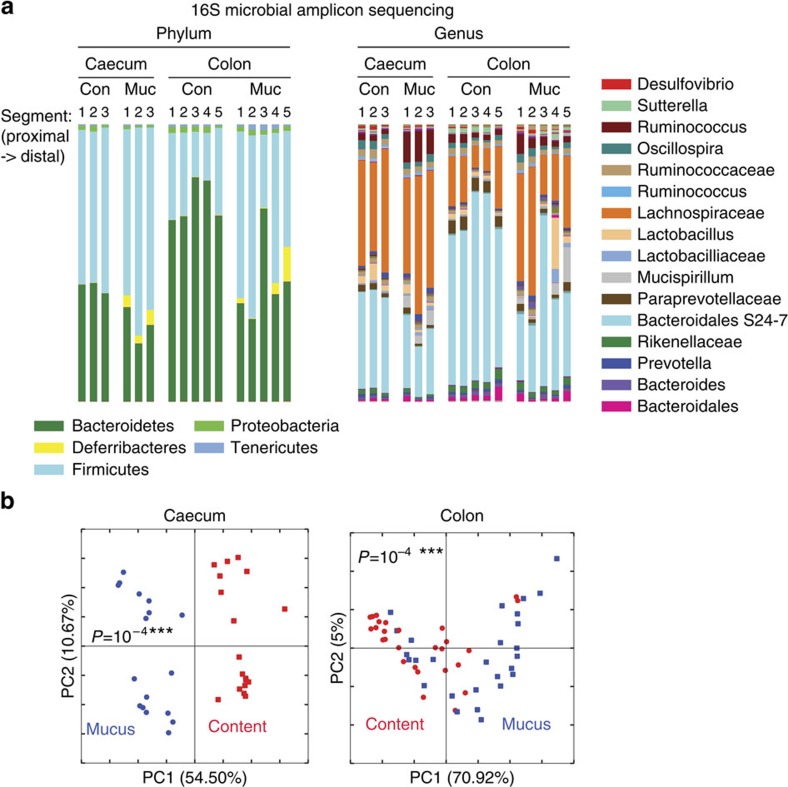
Figure 1. Microbial communities in the mucus layer and content vary in the intestine.
(a) The microbial composition within the mucus layer (Muc) and luminal content (Con) of different segments along the caecum and colon of SPF mice was determined by 16S amplicon analysis. Representative bar graphs from one mouse out of four to six mice per group are shown. (b) Principal coordinates analysis on weighted UniFrac distances was performed on all operational taxonomic units. P-values to determine the statistical significance of clustering were calculated using the Adonis method. Analysis was performed using QIIME 1.8.0.

