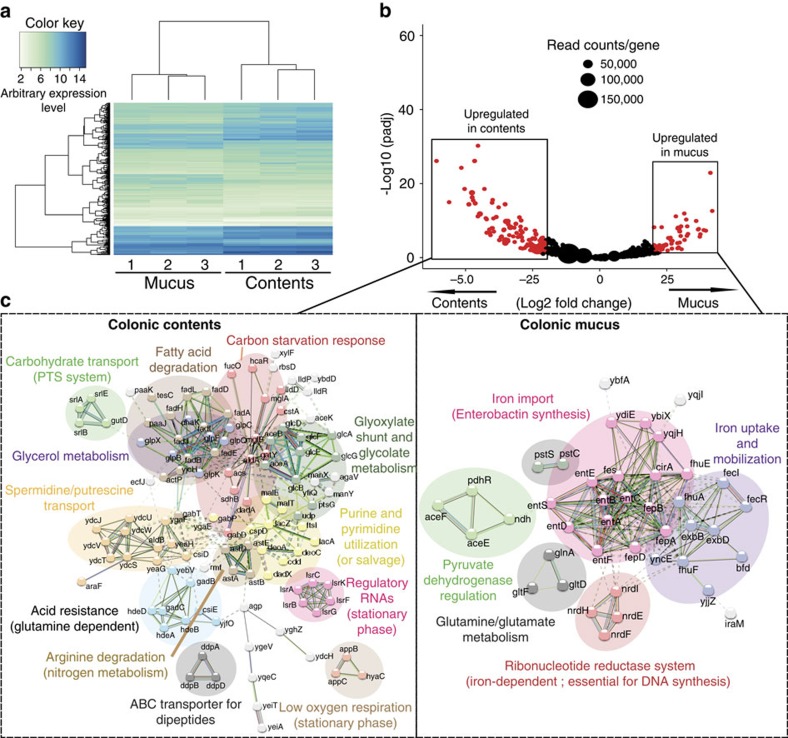
Figure 3. E. coli in colonic mucus and contents has different transcriptional patterns.
(a) A heat map of gene expression values shows differentially expressed genes identified by RNA-seq in bacteria isolated from colonic mucus and contents of E. coli monocolonized C57BL/6 mice. Data include three experimental repeats. (b) A volcano plot was constructed as in Fig. 2b visualizing E. coli transcriptional patterns. (c) Network analysis on E. coli was performed as in Fig. 2c. Original transcriptomic data with annotations are given in Supplementary Data 2.

