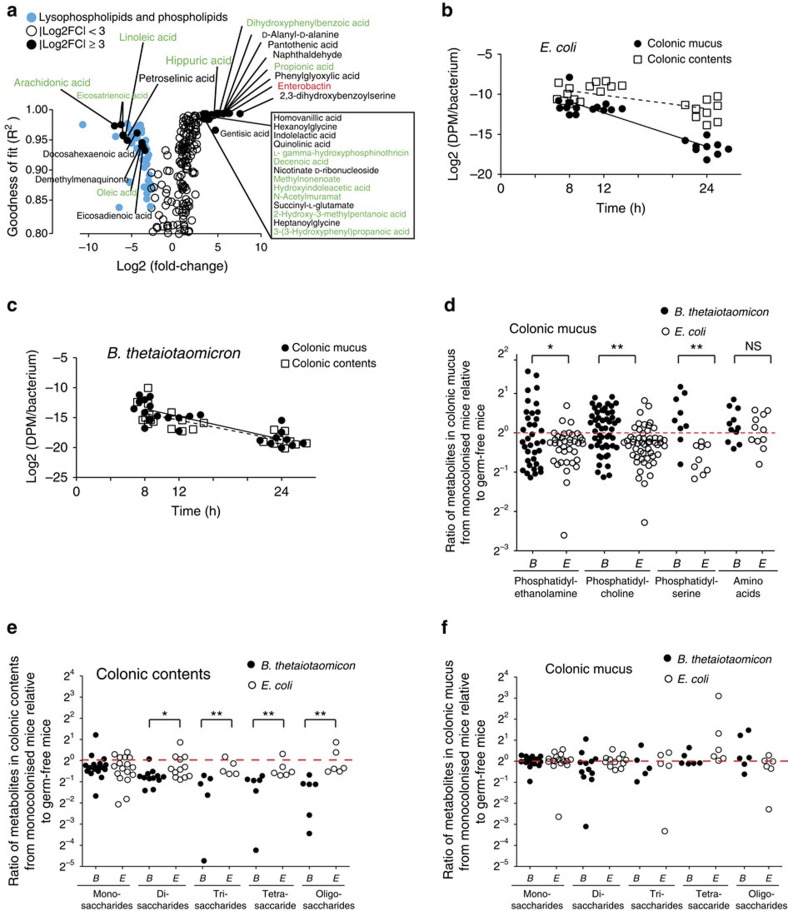
Figure 5. Ex vivo and in vivo metabolites consumption assay and bacterial replication dynamics.
(a) E. coli was cultured on colonic mucus and luminal contents harvested from germ-free mice (n=4). The consumed and secreted metabolites were identified at sequential time points comparing metabolic patterns before and after E. coli growth by non-targeted mass spectrometry analysis. R2 values representing the goodness of exponential fit of nonlinear regression indicate the continuity of metabolite variation trend among the time course. Metabolites with annotations labelled in green indicate possible alternative molecular species desigations (listed in full in Supplementary Data 5). (b) E. coli and (c) B. thetaiotaomicron replication rates in colonic mucus and contents from monocolonized mice were addressed by 32P-radioactivity decay after metabolic labelling of the test bacteria. Data are pooled from three independent experiments. (d) The average intensity of classified phospholipids detected directly ex vivo from colonic mucus from E. coli monocolonized mice (n=4), B. thetaiotaomicron monocolonized mice (n=4) were compared with germ-free mice (n=4). Comparison of detected common amino acids served as a control group. The red dotted line indicates ratios of unity between monocolonized and germ-free status. (e,f) Metabolites classified as oligosaccharides from (e) colonic contents or (f) colonic mucus were compared directly ex vivo as described for d. NS, not significant.

