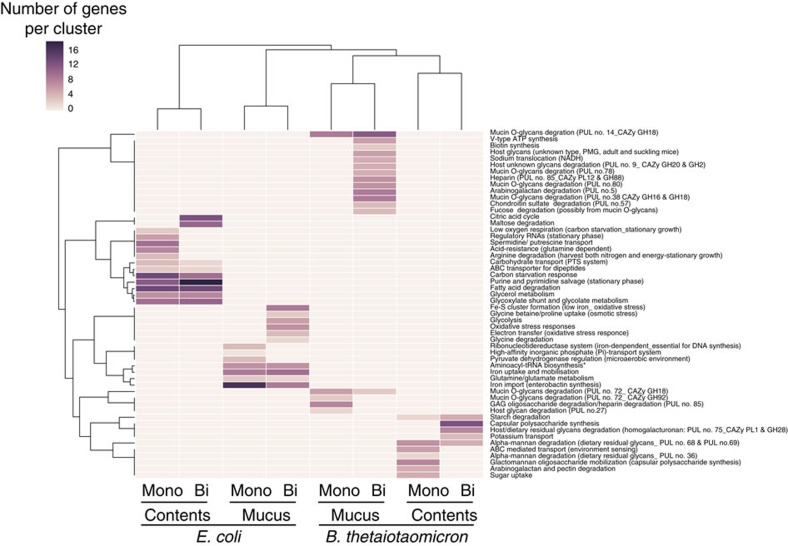
Figure 8. Gene cluster distribution allows discrimination between mucus and content compartments.
A heat map of the correlation of each cluster identified in the STRING analysis and the number of genes each cluster is shown. The unsupervised profiles for each experimental condition clustered E. coli and B. thetaiotaomicron separately, whereas regrouping profiles for monocolonization and bicolonization for each compartment and microbe.

