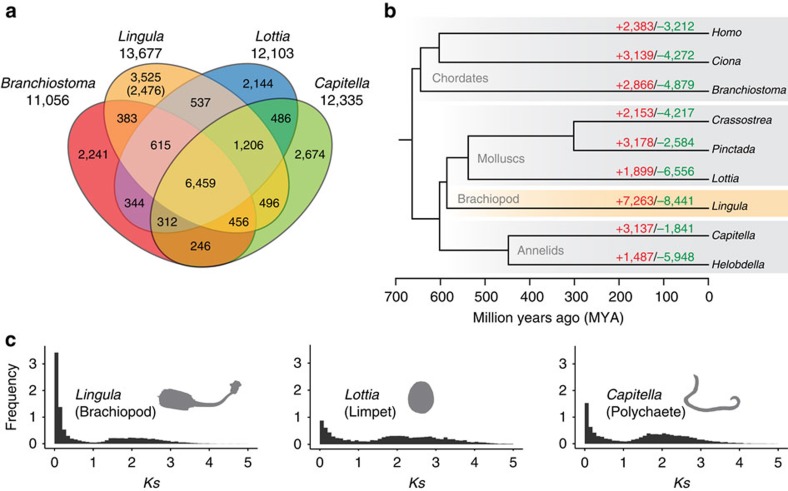
Figure 2. Evolution of the Lingula genome is revealed by comparative genomics of lophotrochozoan gene families.
(a) Venn diagram of shared and unique gene families in four metazoans. Gene families were identified by clustering of orthologous groups using OrthoMCL. The number in parentheses shows unique gene families compared among 22 selected metazoan genomes. (b) Gene family history analyses with CAFE. Divergence times were estimated with PhyloBayes using calibration based on published fossil data. Gene families expanded or gained (red), contracted or lost (green). (c) Frequency of pair-wise genetic divergence calculated with synonymous substitution rate (Ks) among all possible paralogous pairs in the Lingula, Lottia and Capitella genomes.

