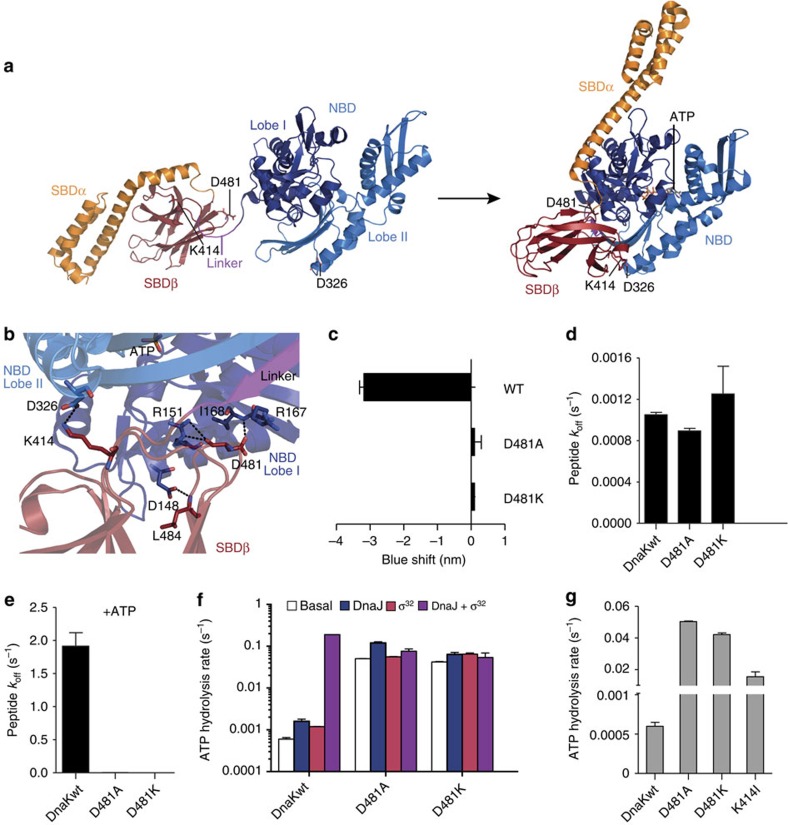
Figure 1. Asp481 is essential for interdomain communication in DnaK.
(a) Hsp70s alternate between closed and open conformations controlled by nucleotides and substrates through an allosteric mechanism. Cartoon representation of DnaK in the ADP-bound closed conformation (left, PDB ID 2KHO) and in the ATP-bound open conformation (right, 4B9Q15). Lobes of the nucleotide-binding domain are coloured in dark blue (I) and light blue (II), SBDβ in dark red and SBDα in orange. The highly conserved interdomain linker is shown in purple. Indicated are residues important for NBD–SBDβ docking. All structure figures were prepared in PyMOL (The PyMOL Molecular Graphics System, Version 1.7.4 Schrödinger, LLC). (b) Zoom into the interface between NBD and SBDβ of the ATP-bound open conformation (PDB ID 4B9Q15), rotated by 180° as compared with the right panel in a. NBD lobes are shown in dark blue and light blue, and SBDβ in dark red and interdomain linker in purple. Residues bridging the domain interface by hydrogen bonds are shown in sticks and coloured according to the atom with carbon in the colour of the respective domain. Putative hydrogen bonds (distances between proton donor and acceptor ≤3.5 Å) are shown as dashed lines. (c) ATP-induced blueshift of the emission maximum of typtophane fluorescence. (d,e) Peptide dissociation rates measured in the absence of nucleotides (d) or presence of ATP (e). (f) Single-turnover ATPase rates in the absence of DnaJ and substrate (basal rate), in the presence of DnaJ, the protein substrate σ32 or both DnaJ and σ32, as indicated. (g) Comparison of basal single-turnover ATPase rates measured in a quenched-flow apparatus for DnaK-D481A, DnaK-D481K and DnaK-K414I. Error bars represent s.e.m. of at least three independent measurements.

