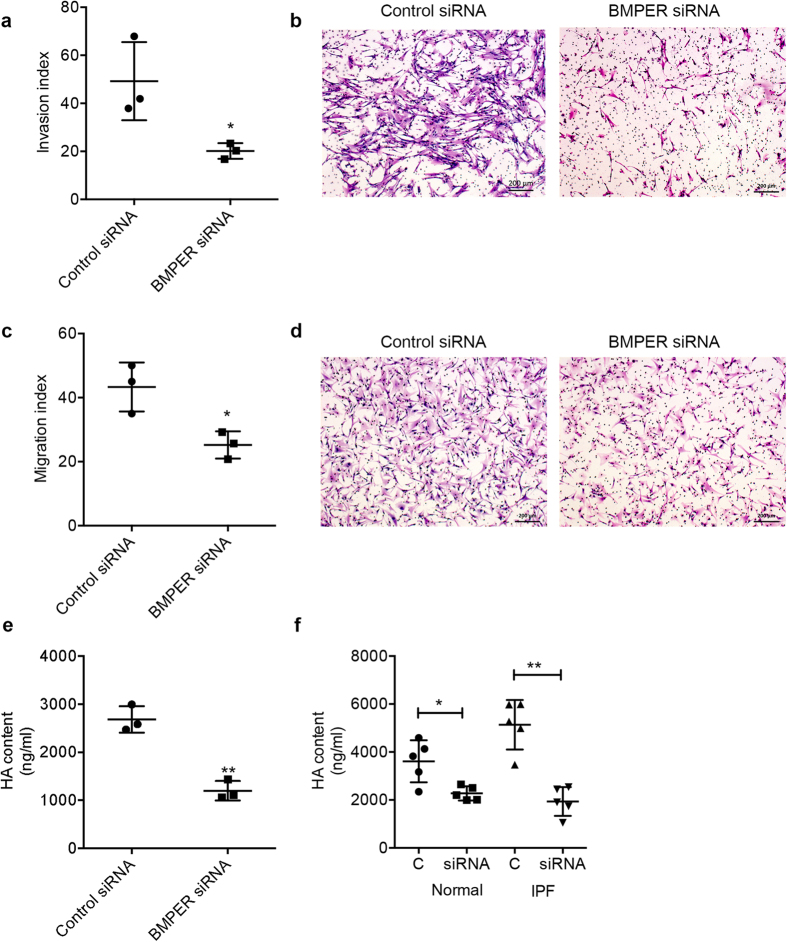
Figure 6. Knocking down BMPER with siRNA reduced migration and invasion capacities and matrix production of fibroblasts.
(a) Cell invasion capacity of MRC5 cells transfected with BMPER siRNA or control siRNA (*P < 0.05, data are mean and SEM, unpaired t test, n = 3 times). (b) Representative images of Invasion (Scale bars, 200 μm). (c) Cell migration capacity of MRC5 cells transfected with BMPER siRNA or control siRNA was assayed with a Boyden chamber (*P < 0.05; data are mean and SEM, unpaired t test, n = 3 times). (d) Representative images of migration (Scale bars, 200 μm). (e) HA concentration of MRC5 cells transfected with BMPER siRNA or control siRNA (HA, Hyaluronan; **P < 0.01; data are mean and SEM, unpaired t test; n = 3 times). (f) HA concentration of normal and IPF lung fibroblasts transfected with BMPER siRNA or control siRNA (HA, Hyaluronan; *P < 0.05; **P < 0.01; data are mean and SEM, unpaired t test, normal n = 5 subjects and IPF n = 5 patients).

