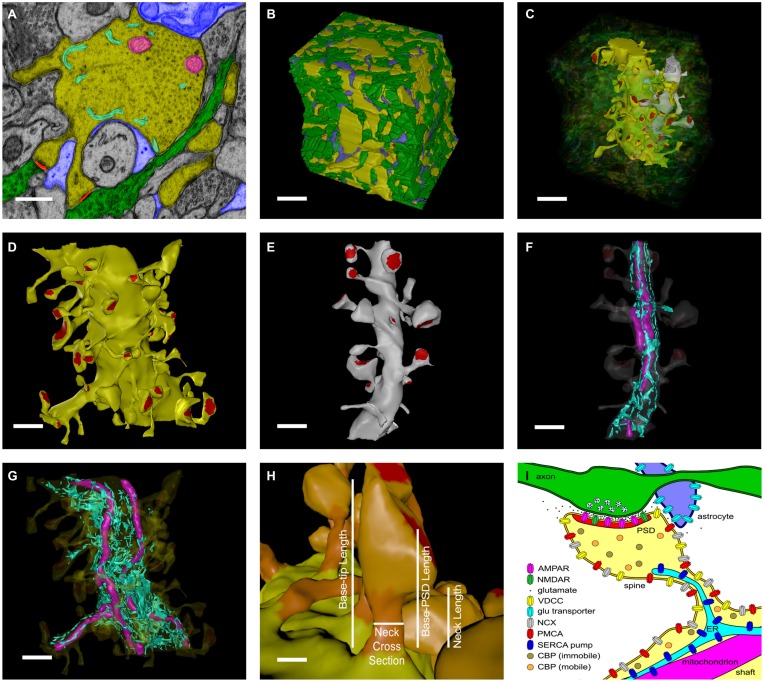
Figure 1.
Reconstruction of hippocampal neuropil. (A) Hand segmentation of 2D-objects within a single EM thin section. The entire reconstruction consisted of 100 serial EM thin sections 50 nm thick. Each plasma membrane bound structure was traced in each thin section but only a few structures are highlighted here for illustrative purposes. A large apical dendrite is highlighted in yellow along with its enclosed endoplasmic reticulum (cyan) and mitochondria (magenta). Spines that are part of the principal dendrite, also shown in yellow, sometimes appear disjoint from the dendrite in a given thin section. Two axons that make synaptic contacts with two spines of the large apical dendrite in this plane of section are shown in green. PSDs and presynaptic active zones were annotated by enclosing them in a separate close-fitting contour (red). Processes of an astrocytic glial cell are shown in blue. Scale bar is 0.5 μm. (B) Reconstructed volume of neuropil. Dendrites are yellow. Axons are green. Astrocyte is blue. The extracellular space was adjusted so that the distance between components was 20 nm using an algorithm described in Kinney et al. (2013). Scale bar is 1 μm. (C) Two dendrites in the reconstructed volume were selected for simulations of glutamatergic synaptic transmission and postsynaptic calcium dynamics. A large apical dendrite is shown in yellow and a smaller branch dendrite is shown in light gray. The selected dendrites are shown in relation to one another embedded in the semitransparent neuropil. The synaptic contact areas (red) on the two selected dendrites were identified and labeled as shown in (D,E). Scale bar is 1 μm. (D,E) The PSD regions (red) of the large apical dendrite (D) and the smaller branch dendrite (E) were annotated. Scale bar is 1 μm. (F,G) Intracellular organelles of the small branch dendrite (F) and large apical dendrite (G), including the reconstructed endoplasmic reticulum (cyan) and mitochondria (magenta). Scale bar is 1 μm. (H) The spine head (light-orange), neck (dark-orange), and dendritic shaft (yellow) were also annotated. Geometric measurements used in the analysis are shown as annotations. The neck cross section area was measured at a point halfway along the length of the neck. Scale bar is 0.25 μm. (I) Summary of all neuropil elements included in the model. The PSD was used to lasso a region of the spine surface for NMDAR and AMPAR placement. Presynaptic vesicles are shown for illustration only and were not included in simulations; instead glutamate was released directly into the synaptic cleft (see Methods Section). Note that about 19% of spines in the reconstruction contained ER protruding from the dendritic shaft into the spine neck and head.

