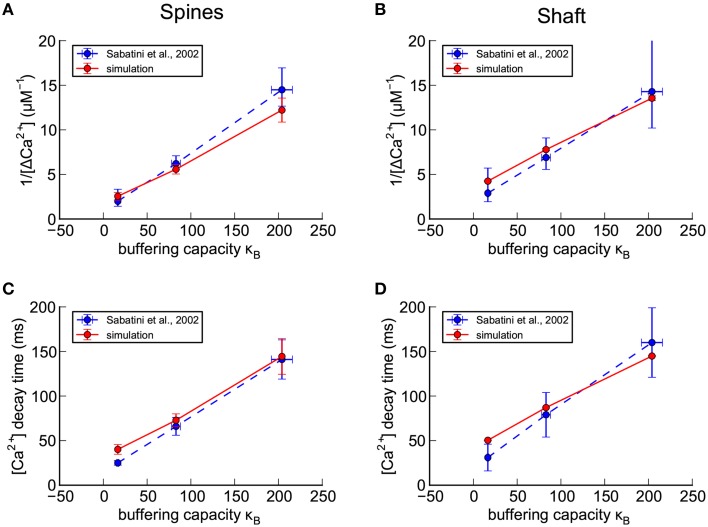
Figure 5.
Calibration of nine parameters in spines and shafts of the small branch spine. (A–D) Confirmation of calibration of the shape of a Ca2+ transient in response to a bAP in the absence of calbindin (see Methods Section). For comparison with experimental results of Sabatini et al. (2002; shown as blue dashed lines), concentrations of exogenous fluorescent calcium indicators in the model were set to 20 μM Fluo4, 50 μM OGB1, or 100 μM OGB1. The simulated results for the best calibrated parameters, averaged for seven spines with volumes ≥ 0.05 fl, are shown as red lines. (A) For each concentration of indicator, the reciprocal of the averaged peaks of the calcium transients in the spines, 1/Δ[Ca2+], is plotted against the buffering capacity in the presence of indicator (κB) calculated as in Sabatini et al. (2002). The Δ[Ca2+], extrapolated to zero indicator, was in the range 0.5 to 1.0 μM (reciprocal of y-axis intercept) with κe in the range 16–50 (x-axis intercept). (B) The reciprocal of the averaged peaks of the calcium transients in the dendritic shaft is plotted against buffering capacity. The Δ[Ca2+], extrapolated to zero indicator, was 0.3 μM with κe = 62. (C) The averaged time constant of calcium decay in the spines is plotted against calcium buffering capacity. The calcium decay time constant, extrapolated to zero indicator in the spines was in the range 20–40 ms (y-axis intercept) with κe in the range 30–80 (x-axis intercept). (D) The averaged time constant of calcium decay in the dendritic shafts was plotted against buffering capacity. The calcium decay time constant, extrapolated to zero indicator in the dendritic shafts was 42 ms with κe = 75.

