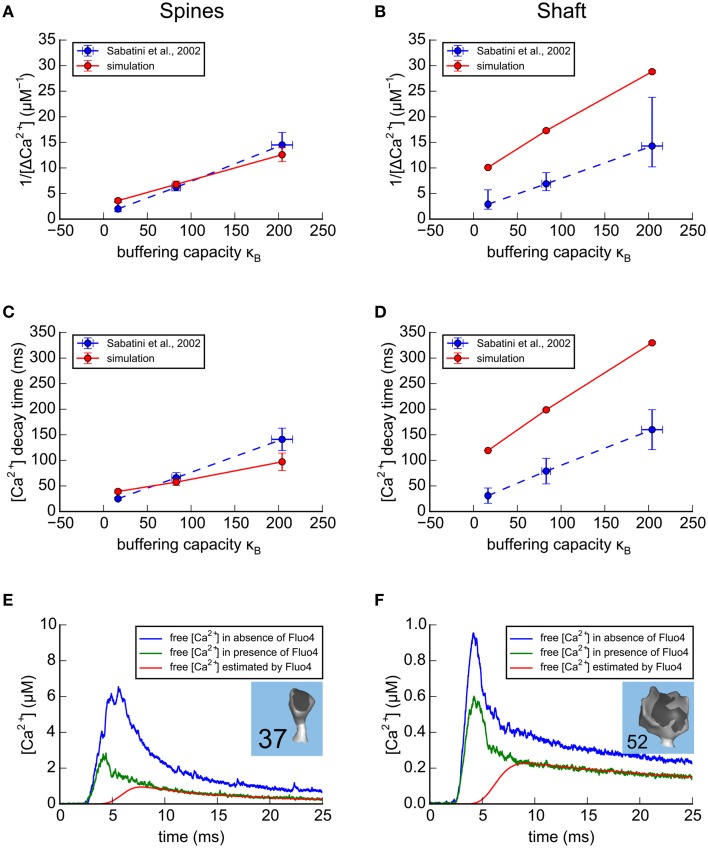
Figure 6.
Results of simulations in the spines and shafts of the large apical dendrite using parameters optimized for the small branch dendrite. (A–D) Simulation of Ca2+ transients in response to a bAP in the absence of calbindin. As in Figure 5, for comparison with experimental results of Sabatini et al. (2002; shown as blue dashed lines), concentrations of exogenous fluorescent Ca2+ indicators in the model were set to 20 μM Fluo4, 50 μM OGB1, or 100 μM OGB1. The simulated results in the large apical dendrite, averaged for the 13 spines with volumes ≥0.05 fl are shown as red lines. (A) For each concentration of indicator, the reciprocal of the averaged peaks of the Ca2+ transients in the spines of the large apical dendrite, 1/Δ[Ca2+], is plotted against the buffering capacity in the presence of indicator (κB) calculated as in Sabatini et al. (2002). The Δ[Ca2+], extrapolated to zero indicator, was in the range 0.3–0.6 μM (reciprocal of y-axis intercept) with κe in the range 40–75 (x-axis intercept). (B) The reciprocal of the averaged peaks of the Ca2+ transients in the dendritic shaft is plotted against buffering capacity. The Δ[Ca2+], extrapolated to zero indicator, was 0.12 μM with κe = 75. (C) The averaged time constant of Ca2+ decay in the spines is plotted against Ca2+ buffering capacity. The Ca2+ decay time constant, extrapolated to zero indicator in the spines was 25 to 40 ms (y-axis intercept) with κein the range 60–120 (x-axis intercept). (D) The averaged time constant of Ca2+ decay in the dendritic shafts was plotted against buffering capacity. The Ca2+ decay time constant, extrapolated to zero indicator in the dendritic shafts was 100 ms with κe = 80. (E,F) Ca2+ transients in two spines of the calibrated model, in response to a bAP. Simulations were run in the presence and absence of 20 μM Fluo4 in a median size spine (E, spine #37, average of 32 trials) and in a large-size spine (F, spine #52, average of 59 trials). The average Ca2+ transients that would be estimated from the fluorescence of 20 μM Fluo4 are shown in red. The average Ca2+ transients, measured in the simulation by counting actual free Ca2+, are shown in the presence of Fluo4 (green), and in its absence (blue).

