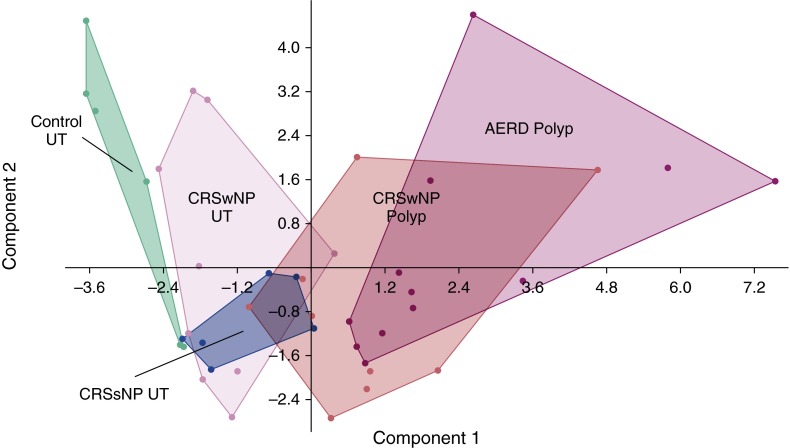
Figure 4.
Principal component analysis (PCA) of inflammatory mediator data. The PCA plot illustrates the first versus second principal component of inflammatory mediator levels in sinonasal tissue. Dots represent individual patients, and distinct clusters of the different disease states and/or tissue types are outlined. The colors represent the various disease states and tissue types. Green = control uncinate tissue (UT); pink = chronic sinusitis with nasal polyps (CRSwNP) UT; blue = chronic rhinosinusitis without nasal polyps (CRSsNP) UT; red = CRSwNP nasal polyp; purple = aspirin-exacerbated respiratory disease (AERD) nasal polyp.

