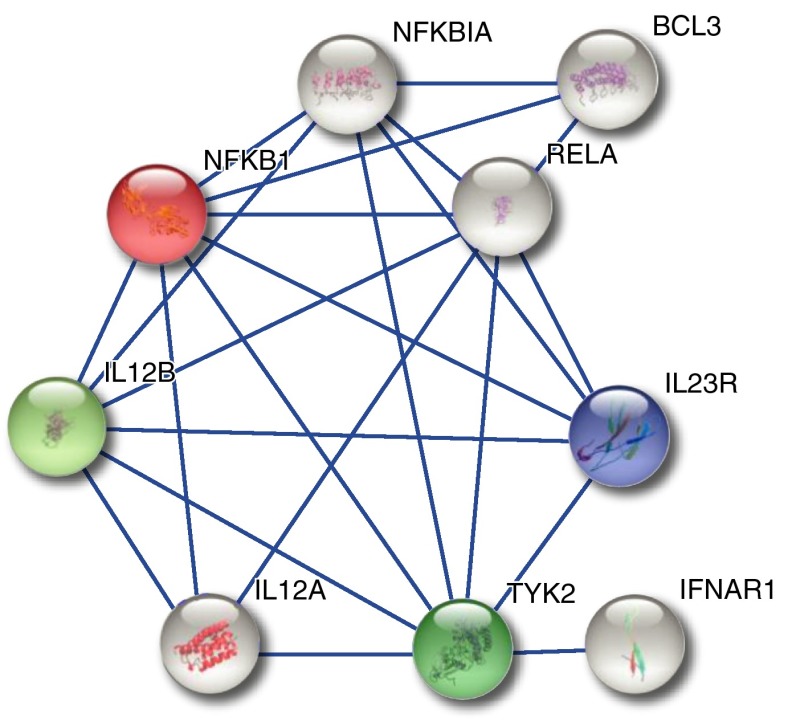
Figure 3.
Protein interaction network, which was generated using STRING based on (1) coexpression of the respective transcripts, (2) experiments, and (3) information from (in parts) curated pathway databases, applying a confidence score >0.7. Colored nodes represent proteins that are or may be affected by sarcoidosis risk variants.

