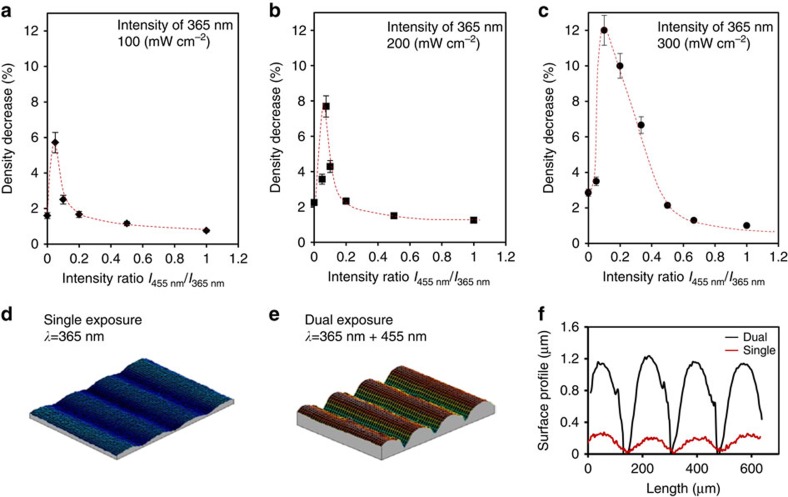
Figure 3. Density change and volume increase under various illumination conditions.
(a–c) Decrease in density of LCN* under the different illumination conditions when 365 nm LED light is blended with 455 nm LED light. The error bars give the deviation within five separate measurements. (d,e) Interference microscopy measurements of the surface profile during (d) exposure to single 365 nm light, and (e) exposure to simultaneous 365 and 455 nm. (f) Corresponding surface profiles measured at a 10-μm film found during one-wavelength 365 nm exposure (red curve) and two-wavelength 365 nm +455 nm exposure (black curve).

