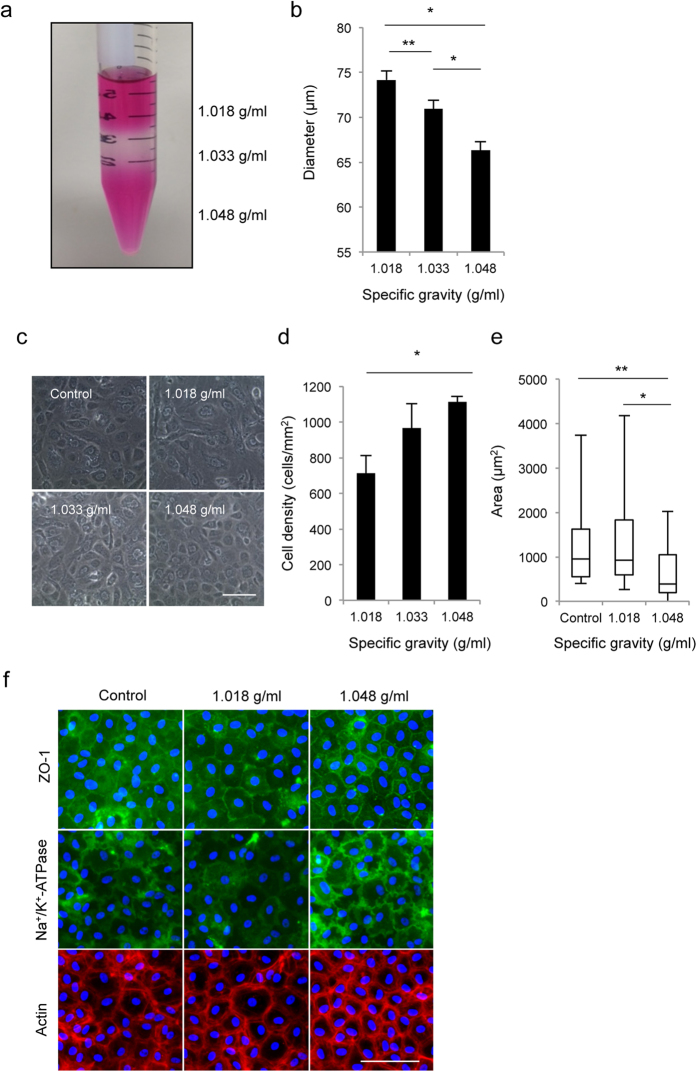
Figure 4. Density-gradient centrifugation of RCECs.
(a) The cultured RCECs, including senescent RCECs with low-CD RCECs, were centrifuged through OptiPrepTM Density Gradient Medium at 800 g for 15 minutes. (b) The diameter of cells recovered from density gradient media with different specific gravity was evaluated by flow cytometry. RCECs were separated according to cell size. *P < 0.01, **P < 0.05. Experiments were performed in triplicate. (c) Cells recovered from density gradient media of different specific gravity were cultured for 2 weeks after cells reached confluence. Representative phase contrast images are shown. (d,e) Cell density and cell area were determined with Image J® (NIH) software. The CD was significantly higher in the CECs recovered from the 1.048 g/ml fraction than from the 1.018 and 1.033 g/ml fractions. The variation in cell size was smaller in the 1.048 g/ml fraction cells than in the control cells. *P < 0.01, **P < 0.05. Experiments were performed in triplicate. (f) Representative images of ZO-1, Na+/K+-ATPase, and actin staining are shown. Nuclei were stained with DAPI. Expressions of ZO-1 and Na+/K+-ATPase were partially disrupted in the control, whereas RCECs recovered from the 1.048 g/ml fraction fully expressed these function-related proteins. Scale bar: 100 μm.

