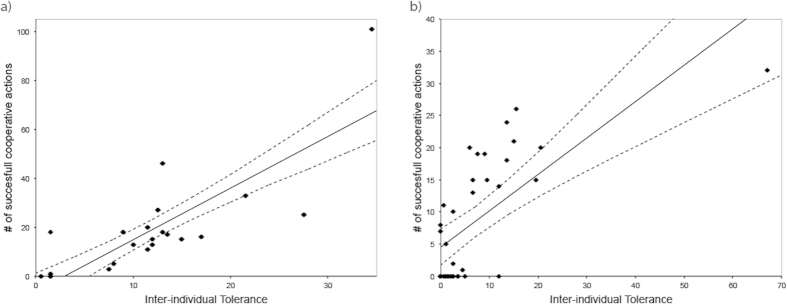
Figure 2.

(a) Mean inter-individual tolerance score per dyad (see ESM) and its relation to cooperative success in the group setting (study 1), and (b) mean inter-individual tolerance score per dyad (see ESM) and its relation to cooperative success in the dyadic setting (study 2). Solid lines reflect trend-lines and dashed lines indicate the 95% confidence intervals.
