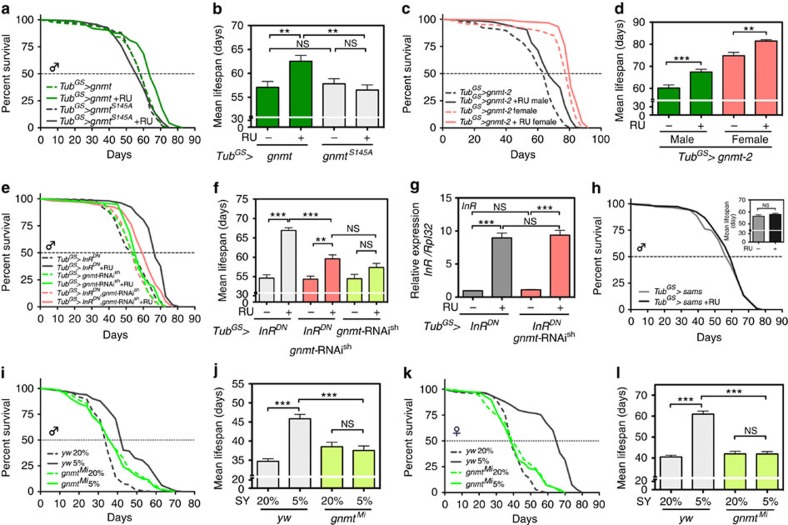
Figure 3. Gnmt is necessary for lifespan extension by reduced insulin signalling or dietary restriction.
(a) Lifespan analysis of Gnmt-overexpressing male flies by TubGS-Gal4. Statistics, log-rank test, gnmt versus gnmt+RU, P<0.0001 (N=117 for gnmt, N=118 for gnmt+RU). gnmtS145A versus gnmtS145A+RU, P=0.7732 (N=111 for gnmtS145A, N=113 for gnmtS145A+RU). (b,d,f,j,l) Average lifespan. One-way analysis of variance (ANOVA) with Bonferroni's multiple comparison test was used for statistical analysis. (c) Lifespan analysis of gnmt-overexpressing male and female flies by TubGS-Gal4. UAS-gnmt integrated on attP2 site is used. Statistics, log-rank test, gnmt-2 male versus gnmt-2+RU male, P<0.0001 (N=116 for each). gnmt-2 female versus gnmt-2+RU female, P<0.0001 (N=116 for each). (e) Lifespan analysis of male flies overexpressing InRDN (dominant-negative form of the insulin receptor), gnmt-RNAish or both. Statistics, log-rank test, InRDN versus InRDN+RU, P<0.0001 (N=158 for InRDN, N=154 for InRDN+RU). gnmt-RNAish versus gnmt-RNAish+RU, P=0.0478 (N=80 for both). InRDN, gnmt-RNAish versus InRDN, gnmt-RNAish+RU, P<0.0001 (N=142 for InRDN, gnmt-RNAish, N=154 for InRDN, gnmt-RNAish+RU). (g) qRT–PCR analysis of InR in day-7 adult male flies treated RU486 for 5 days. Error bars represent mean±s.e.m. (N=4). Statistics, one–way ANOVA with Bonferroni's multiple comparison test. (h) Lifespan analysis of male flies overexpressing sams. Statistics, log-rank test, sams versus sams+RU, P=0.6381 (N=135 for sams, N=143 for sams+RU). Inset, average lifespan. (i) Lifespan analysis of male gnmtMi flies under dietary restriction. Statistics, log-rank test, yw 20 versus 5%, P<0.0001 (N=134 for 20%, N=132 for 5%). gnmtMi 20 versus 5%, P=0.5904 (N=133 for 20%, 129 for 5%). (k) Lifespan analysis of female gnmtMi flies under dietary restriction. Statistics, log-rank test, yw 20 versus 5%, P<0.0001 (N=140 for 20%, N=133 for 5%). gnmtMi 20 versus 5%, P=0.9107 (N=134 for 20%, 136 for 5%). *P<0.05, **P<0.01, ***P<0.001 from the biological replicates. NS, not significant.

