. 2015 Sep 2;4:e09800. doi: 10.7554/eLife.09800

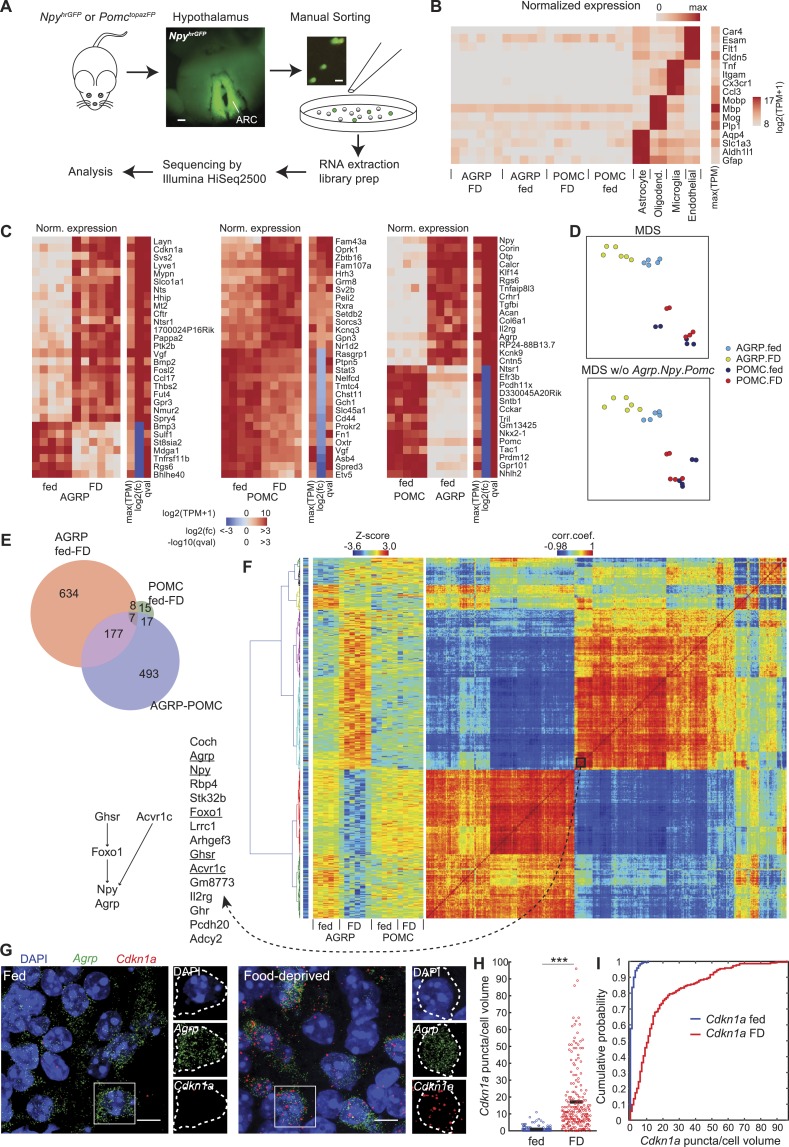
Figure 1. Cell type-specific transcriptomic profiling of starvation-sensitive neurons.

(A) Schema for dissection and sorting of fluorescent neurons from the hypothalamic arcuate nucleus (ARC) followed by cell type-specific RNA-Seq. Scale: ∼200 µm (left), ∼20 µm (right). (B) Expression levels of marker genes for astrocytes, myelin oligodendrocytes, microglia, and endothelial cells indicate high purity of AGRP and POMC samples. FD: 24-hr food-deprived. Left, for each sample, log expression levels for a single gene in each row normalized by maximum expression level of the transcript in any of the samples. Right, sidebar shows maximum expression level for each row (each transcript) across all samples. TPM: transcripts per million. (C) Top 30 differentially expressed genes (DEG) for: AGRP neurons, FD/fed; POMC neurons, FD/fed; AGRP/POMC neurons (fed). FD: 24-hr FD. As in (B), each row corresponds to a transcript where the expression level in each sample is normalized by maximum expressions on level in the row. The sidebars show maximum expression level [max(TPM)] across samples in each row (each transcript). In addition, log2(fold-change) [log2(fc)], and q-value (qval) for the differential expression across fasted/fed states (left and middle) or AGRP/POMC expression levels are shown. (D) Top, multidimensional scaling (MDS) projection of distance (1-corr.coef.) between samples. Bottom, MDS without Agrp, Npy and Pomc genes in the calculation. (E) Venn diagram for DEG between FD and fed conditions (AGRP FD-fed: red, POMC FD-fed: green) and between AGRP and POMC neurons (both fed, purple). Reported DEG required q-value <0.05, abs[log2(fc)] > 1 and mean CPM > 20 in at least 1 cell type/condition (see ‘Materials and methods’). (F) Hierarchical clustering of DEG. Matrix in the middle indicates standardized expression level for the samples (columns) and DEG (rows). The matrix on the right shows the correlation coefficients between genes, calculated across all samples. The colormap on the left indicates maximum TPM expression level in log2 scale, which ranges from 2.96 (blue) to 15.6 (red). Left, genes in a cluster that comprise known pathways that regulate Agrp and Npy expression. (G) Representative images of double single molecule fluorescence in situ hybridization (smFISH) for Agrp and Cdkn1a. Scale, 10 μm. (H, I) Population counts (bars: mean value) (H) and cumulative probability distributions (I) of Cdkn1a puncta per cell volume in AGRP neurons (p = 1.5e−53, Kolmogorov–Smirnov [ks]-test). ***p < 0.001. Fed, n = 189 cells; FD, n = 215 cells; 3 mice per condition.

DOI: http://dx.doi.org/10.7554/eLife.09800.003

Figure 1.

Figure 1—figure supplement 1. Comparison of AGRP and POMC neuron transcriptomic samples.

Figure 1—figure supplement 1.

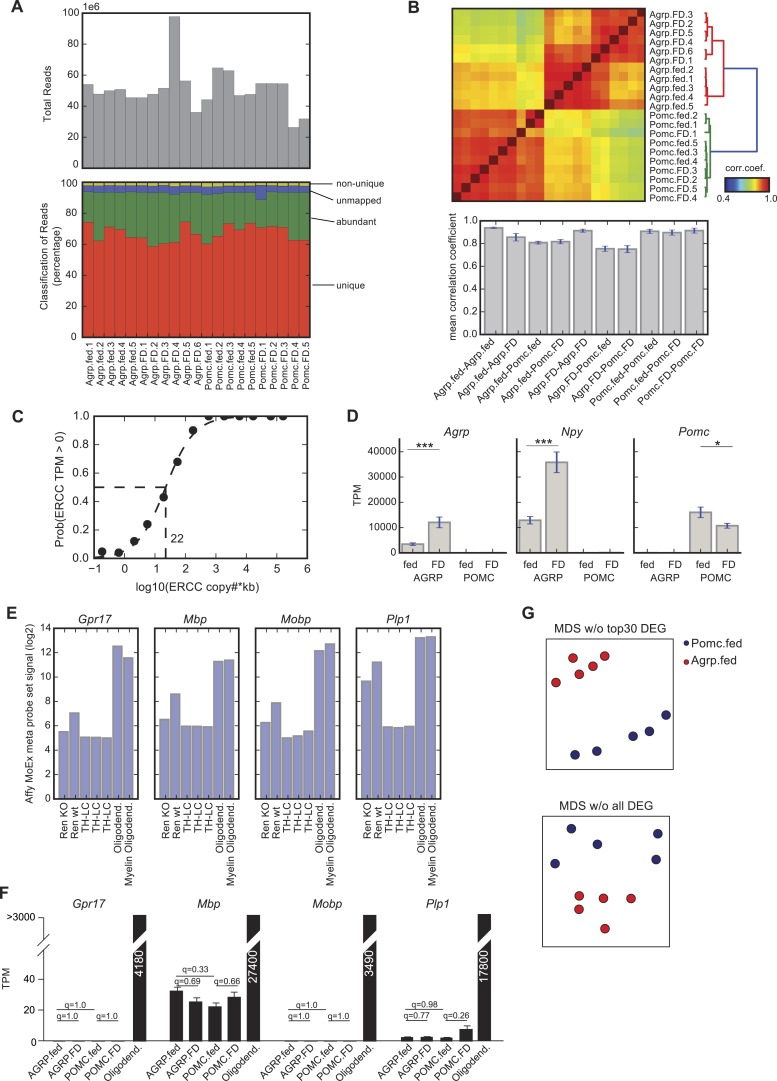
(A) Sequencing statistics. Upper panel shows the total reads for each sample. Lower panel shows classification of reads into uniquely mapped to the genome (unique), mapped to ribosomal RNA, mitochondrial genome, phiX or low complexity sequences (abundant), unmapped to neither of the above (unmapped), or mapped to the genome but to multiple locations (non-unique). (B) Upper panel shows the correlation coefficients calculated using robustly expressed genes (some group has average TPM > 20) and lower panel shows the average and standard deviation of correlation coefficients within group and between groups. (C) Sensitivity of the assay was calculated from ERCC spike-in data. 50–50% detection probability is obtained at 22 copies × kb transcripts. (D) Gene expression of Agrp, Npy and Pomc in AGRP and POMC neurons under fed and FD conditions. Data is mean ± s.e.m. ***q < 0.005, *q < 0.05. (E) Evidence for oligodendrocyte contamination in one of the fluorescence activated cell sorted AGRP neurons samples (Ren-wt) from Ren et al. (2012), which is compared to AGRP neuron-specific Foxo1 knockout (Ren-KO), as well as three samples of manually sorted Th-expressing neurons from the locus coeruleus (as an example of low contamination samples), and purified samples of oligodendrocytes or myelin oligodendrocytes (Cahoy et al., 2008). Gpr17, Mbp, Mobp, and Plp1 are all highly expressed in oligodendrocytes and are also found differentially expressed in the wildtype AGRP neuron sample from microarray data from Ren et al. (2012). Data from all seven samples were generated on the same Affymetrix mouse exon array platforms and processed together. Y-axis is standardized probe set signal from the arrays on a log2 scale. (F) The AGRP and POMC neuron samples generated in our study and processed by RNA-Seq are compared for oligodendrocyte markers and to RNA-Seq data from purified oligodendrocyte samples (Zhang et al., 2014a). There were no statistically significant differences in the oligodendrocyte in the groups that are compared in this study. (G) MDS projection of distance (1-corr.coef.) between AGRP and POMC neurons where correlation coefficients were calculated without the top 30 DEG (top) or with all DEG (based on criteria in ‘Materials and methods’) removed (bottom).

Figure 1—figure supplement 2. DEG in AGRP and POMC neurons with food deprivation.

Figure 1—figure supplement 2.

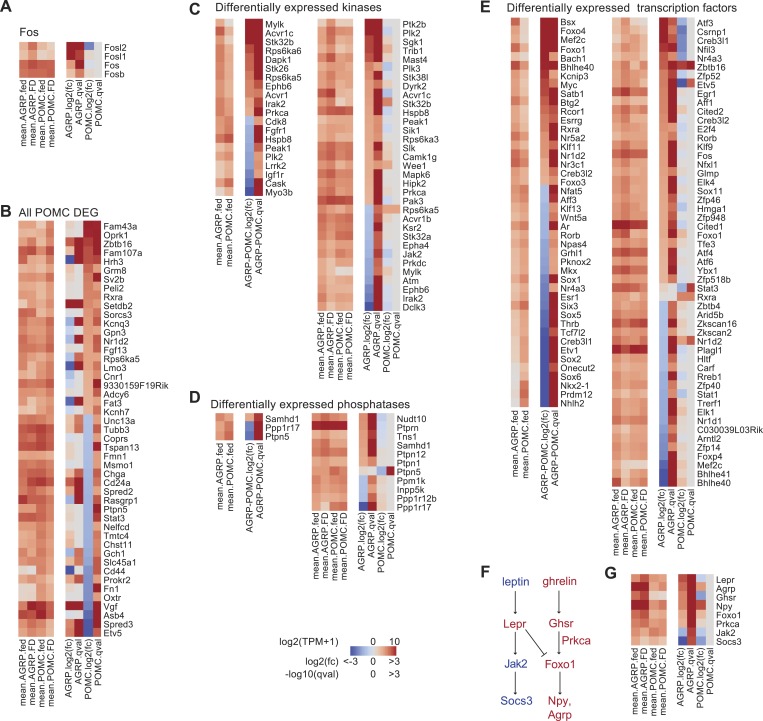
(A) Gene expression of Fos and related genes. Left, mean expression level [log2(TPM)] of each transcript for each experimental group. Right, log2(fold-change) and q-values for differential expression between FD and fed states separately for AGRP and POMC neurons. (B) All DEG during food deprivation from POMC neurons. (C) Differentially expressed kinase genes between AGRP and POMC neurons (left) or AGRP or POMC neurons FD/fed (right). Differentially expressed kinase genes after food deprivation were over-represented in samples from AGRP but not in POMC neurons during food deprivation (AGRP: p = 0.0026, POMC: p = 0.66; hypergeometric test). (D) Differentially expressed phosphatase genes between AGRP and POMC neurons from fed mice (left) or separately from AGRP or POMC neurons comparing FD/fed groups (right). (E) Differentially expressed transcription factor genes between AGRP and POMC neurons from fed mice (left) or separately from AGRP or POMC neurons comparing FD/fed groups (right). Differentially expressed transcription factor genes were over-represented in samples from AGRP and POMC neurons during food deprivation (AGRP: p = 3.1e−5, POMC: p = 0.02; hypergeometric test). (F) Canonical signaling pathways in AGRP and POMC neurons for leptin and ghrelin signaling (red: upregulated, blue: downregulated in RNA-Seq dataset). (G) Expression changes for transcripts associated with leptin and ghrelin signaling pathways.