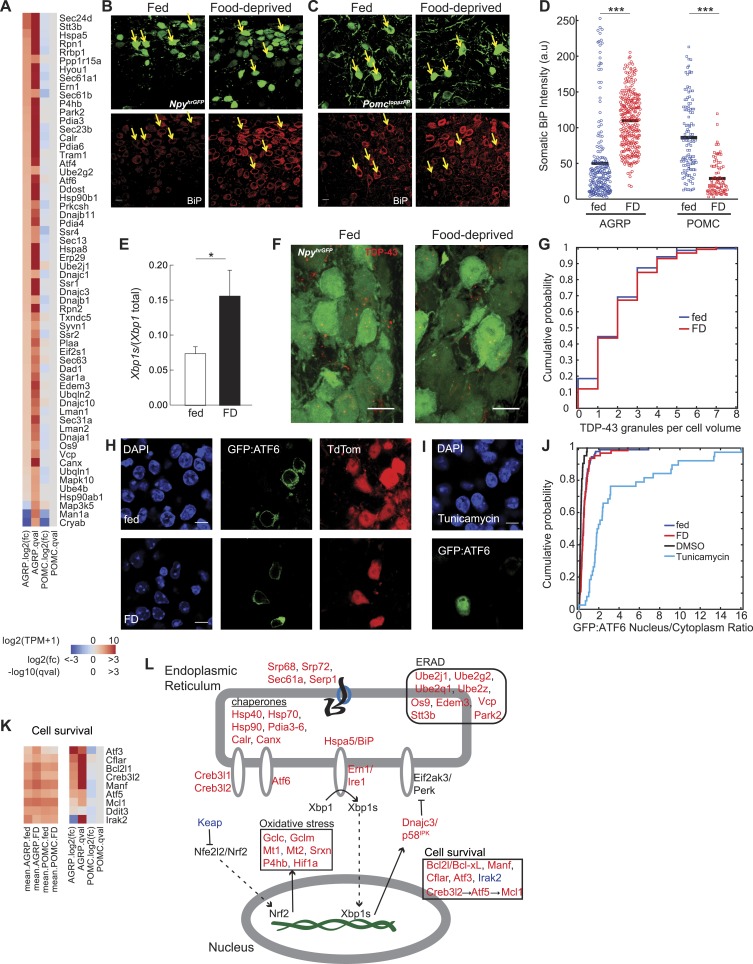
Figure 2. Food deprivation induces unfolded protein response in AGRP neurons.
(A) Log2(fold-change) [log2(fc)] and q-values for genes associated with endoplasmic reticulum (ER) localization (KEGG pathway: mmu04141) that are affected by food deprivation in AGRP (left columns) or POMC (right columns) neurons. (B, C) Representative images showing BiP-immunofluorescence from NpyhrGFP or PomctopazFP mice. Arrows: examples of fluorescently labeled (B) AGRP and (C) POMC neurons used for BiP quantification. Scale: 10 μm. (D) Population counts of BiP somatic intensity in AGRP or POMC neurons. AGRP.fed, n = 209; AGRP.FD, n = 283; POMC.fed, n = 121; POMC.FD, n = 92; 3 mice per condition. Bars: mean values. Rank-sum test. ***p < 0.001. (E) Fraction of spliced to total Xbp1 transcript isoforms in AGRP neurons. Unpaired one-tailed t-test. *p < 0.05. (F, G) Representative images (F) and cumulative probability distribution (G) of TDP43-immunoreactive-granules (red) in GFP-expressing AGRP neurons (p = 0.76, ks-test). Fed, n = 276; FD, n = 174; 2 mice per condition. Scale, 10 μm. (H–J) Representative images (H, I) of GFP:ATF6 expression AgrpCre;ai9(tdtomato) mice. Cumulative probability distribution (J) of the ratio of nuclear to cytoplasmic GFP fluorescence in AGRP neurons: fed vs FD (p = 0.44, ks-test) Fed, n = 92; FD, n = 63; 4 mice per condition; or AGRP neurons: DMSO vs tunicamycin (p = 2.9e−16, ks-test) DMSO, n = 42; Tunicamycin, n = 38; 1 mouse per condition. (K) Differentially expressed cell survival genes. Left, mean expression level [log2(TPM)] of each transcript of each experimental group. Right, log2(fold-change) and q-values for differential expression between FD and fed states separately for AGRP and POMC neurons. (L) Schematic for DEG in ER stress-associated pathways in AGRP neurons after food-deprivation. Red: upregulated expression, Blue: downregulated expression.

