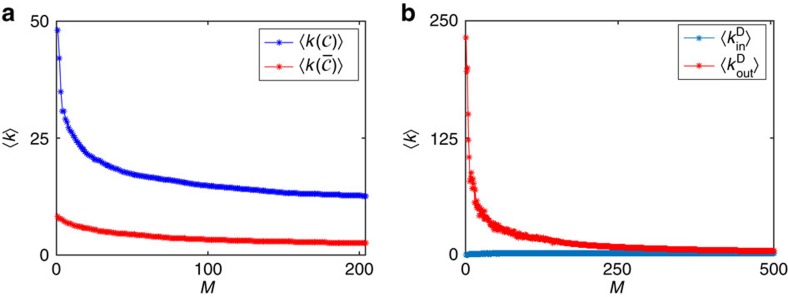
Figure 4. Signature of the controllable and driver nodes.
(a) Plot of the average degree of the controllable nodes  (blue) and of the non-controllable nodes
  (red) for the Small World and Griffith citation network. (b) Plot of the average indegree
  (blue) and outdegree
  (red) of the driver nodes versus the number of driver nodes for the Small World and Griffith citation network. In both panels, M is the number of driver nodes deployed.

