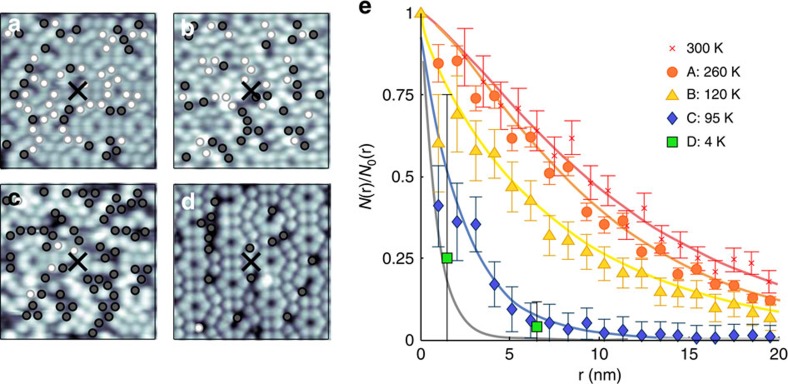
Figure 2. Nonlocal manipulation as a function of temperature.
STM images (12 × 12 nm,+1 V, 100 pA) of chlorobenzene molecules on the Si(111)-7 × 7 surface following charge injection [+2.7 V, 800 pA, 80 s (a–c),+2.7 V, 100 pA, 160 s (d)] at the sites indicated by X: surface and tip at (a) 260 K, (b) 120 K, (c) 95 K and (d) 4 K. White circles indicate locations of molecules that are displaced due to the charge injection. Black circles indicate sites of molecules that are unmoved. (e) Radial distribution of displaced molecules as a function of the distance from the injection site at temperatures indicated. Each decay curve is the average of several (∼5) experiments. Lines are fits to the 2D diffusion, single decay channel transport model given by equation 1.

