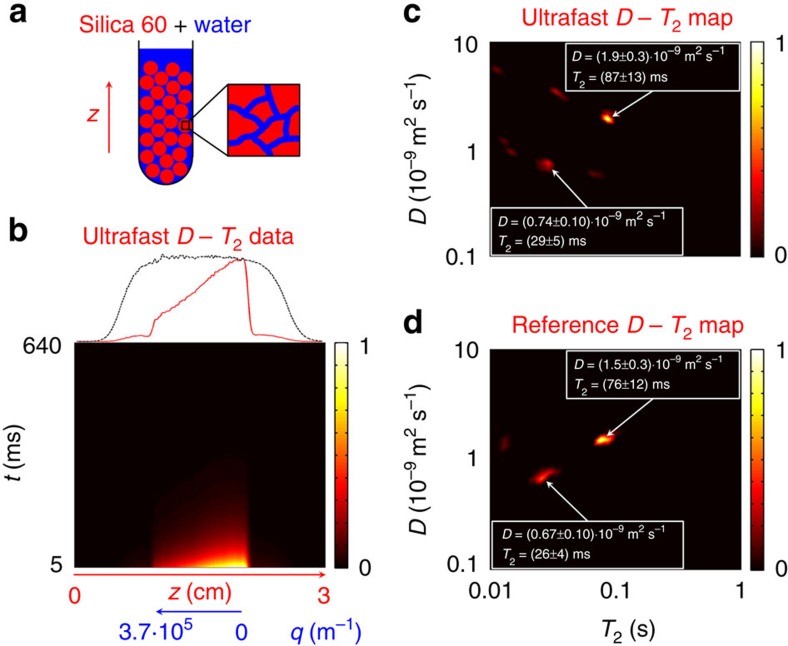
Figure 2. Resolving different physical environments of molecules.
(a) Schematics of the sample consisting of porous silica gel 60 powder immersed in water (1% H2O in D2O). (b) Experimental ultrafast D–T2 data after the Fourier transform in the spatial frequency dimension. The first row (red) is shown on the top along with the coil sensitivity profile (black). (c) Ultrafast D–T2 map including one peak arising from water in the pores (D=0.74·10−9 m2 s−1, T2=29 ms) and the other from water between the particles (D=1.9·10−9 m2 s−1, T2=87 ms). The map is the result of a 2D Laplace inversion of experimental data corrected using the coil sensitivity profile in the region affected by the frequency-swept pulse (z=0.96–1.99 cm). (d) Corresponding reference map obtained in the conventional D–T2 correlation experiment. The experiments were carried out at 300 MHz 1H frequency. The total time in the conventional experiment was 46 min, using eight scans per increment, while only 2 min 30 s were required with a total of 32 scans in the ultrafast experiment.

