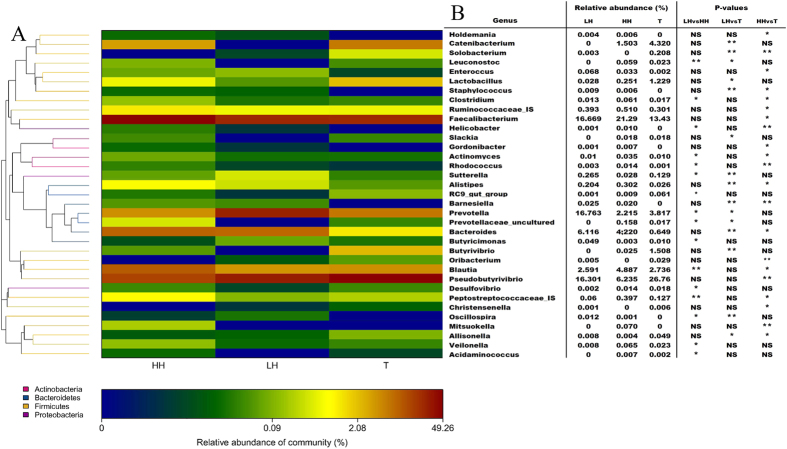
Figure 3. Heatmap of the distribution of the relative abundance of the genera.
(A) Taxonomic classification of the genera. (B) Genera detected and statistical analysis among three groups (Metastats for the sequence count data). LH = Chinese Han living in Shaanxi; HH = Chinese Han living in Tibet; T = Tibetans. Significance: NS > 0.05, *≤0.05; **≤0.01.

