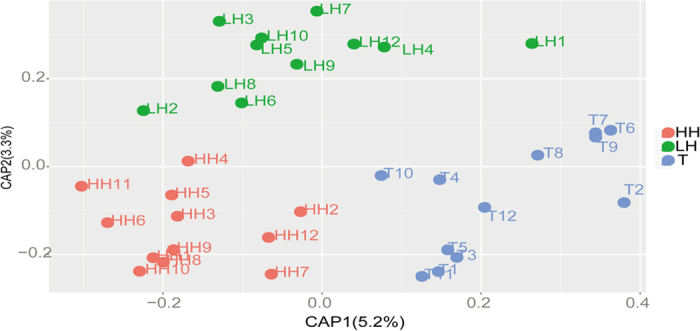
Figure 5. Canonical analysis of principal coordinates (CAP) of human gut microbiota with different ethnicity and altitude.

CAP1 was the ethnic axis and CAP2 was the altitude axis. ANOVA test showed significant influence of the two constraints (p = 0.001). LH = Chinese Han living in Shaanxi; HH = Chinese Han living in Tibet; T = Tibetans.
