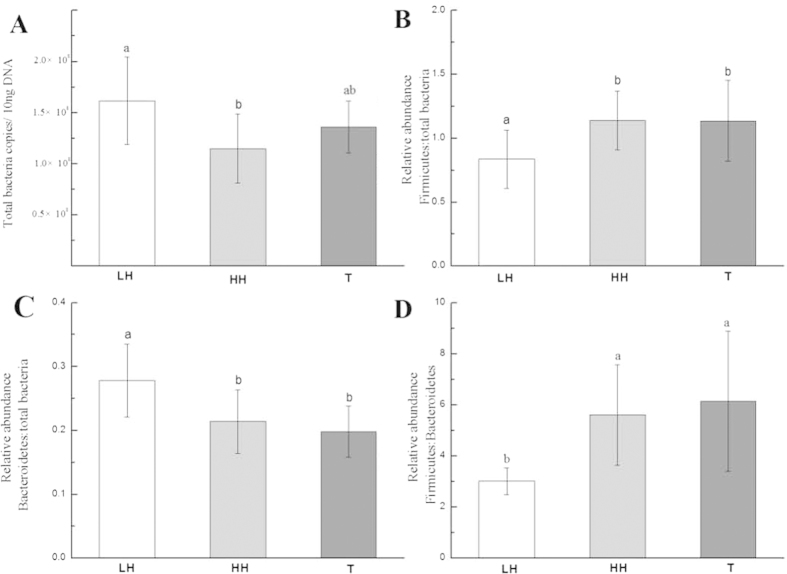
Figure 6. Relative abundance of total bacteria per 10 ng DNA (A), ratios of Firmicutes:total bacteria (B), ratios of Bacteroides:total bacteria (C), and ratios of Firmicutes:Bacteroides (D) in the fecal samples of three groups.a,b.
Different lower-case letters indicate significant differences between groups. LH = Chinese Han living in Shaanxi; HH = Chinese Han living in Tibet; T = Tibetans.

