Figure 6.
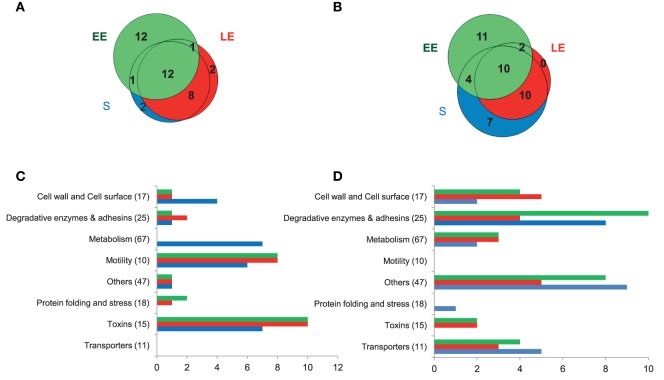
Distribution of extracellular proteins detected by shotgun proteomics showing significant abundance level changes (p < 0.05) between wild-type and ΔentD mutant strains. (A,B) Venn diagrams showing the numbers of downregulated (A) and upregulated proteins (B) in the ΔentD mutant strain in early exponential (EE), late exponential (LE), and stationary (S) growth phases. (C,D) Distribution of downregulated (C) and upregulated (D) proteins into 8 groups according to their functions during the EE, LE, and S growth phases. The number of total proteins identified in each functional group is given in brackets.

