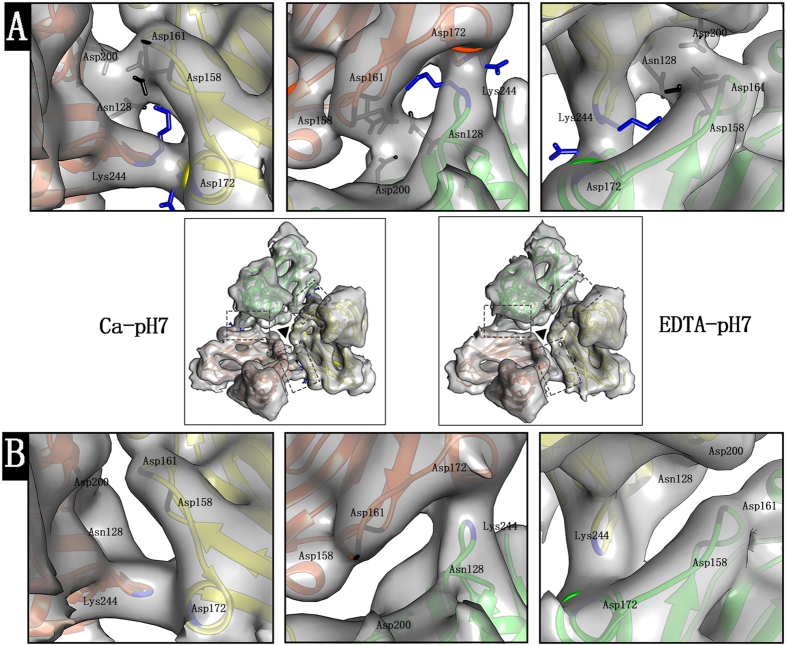
Figure 3. Interactions between the subunits within one asymmetric unit.
(A) Zoom-in view of the linking densities boxed in the subunit interfaces within one asymmetric unit under Ca-pH7 located in the middle panel between panel (A) and panel (B) (left). One linking density is surrounded by the residues Asn128, Asp158, Asp161 and Asp200, colored in black, and the other linking density is surrounded by the residues Lys244 and Asp172, colored in blue. (B) Zoom-in view of the linking densities boxed in the subunit interfaces within one asymmetric unit under EDTA-pH7 located in the middle panel between panel (A) and panel (B) (right). The linking density is surrounded by the residues Lys244 and Asp172. The centers of the asymmetric units are marked with black triangles. The density maps are normalized and visualized with the contour level set at 2.5 in Chimera.

