Figure 1.
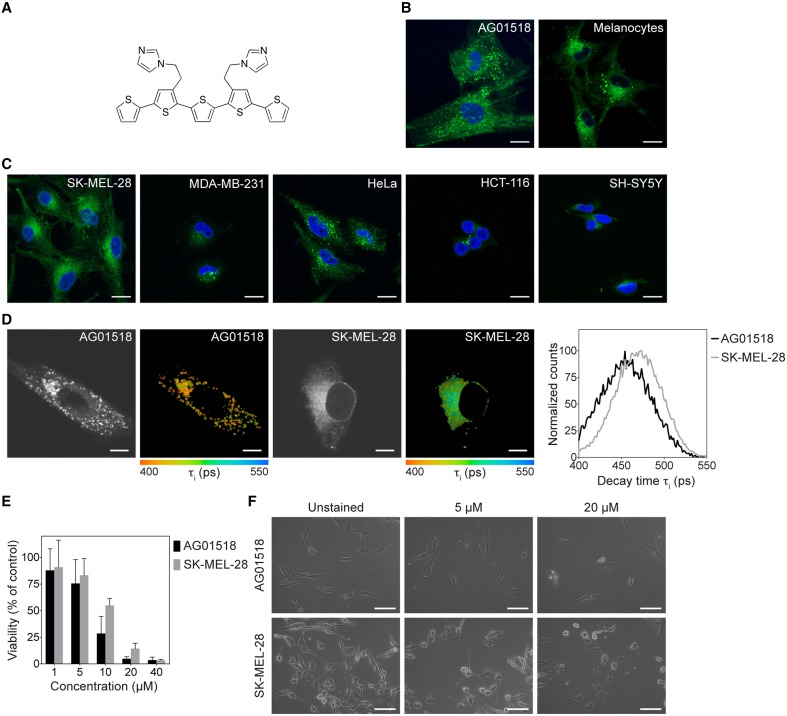
Chemical structure of p-HTIm and fluorescence images of p-HTIm staining in normal and malignant cells. (A) The chemical structure of p-HTIm. Fluorescence images of (B) normal cells: human fibroblasts (AG01518) and melanocytes, and (C) malignant cells: melanoma cells (SK-MEL-28), breast cancer cells (MDA-MB-231), cervical cancer cells (HeLa), colon cancer cells (HCT-116), and neuroblastoma cells (SH-SY5Y) stained with p-HTIm. p-HTIm staining is observed in green and cell nuclei were counterstained with DAPI (blue). Scale bars 20 μm. (D) Fluorescence lifetime images and lifetime decay curves of human fibroblasts and melanoma stained with p-HTIm. The contrast-images, as well as the color-coded images according to the fluorescence decay of p-HTIm verified the difference in intracellular localization of the dye. The life time decay curves (right) were also slightly different for the two cell lines. Scale bars represent 10 μm. (E) Cell viability as measured by the MTT assays of human fibroblasts and melanoma cells stained with p-HTIm at different concentrations (1–40 μM). (F) Phase contrast images of cells 24 h after staining. Scale bars 100 μm. If nothing else stated, cells were stained with 5 μM p-HTIm for 30 min and then incubated in fresh medium for 24 h prior to analysis.

