Figure 2.
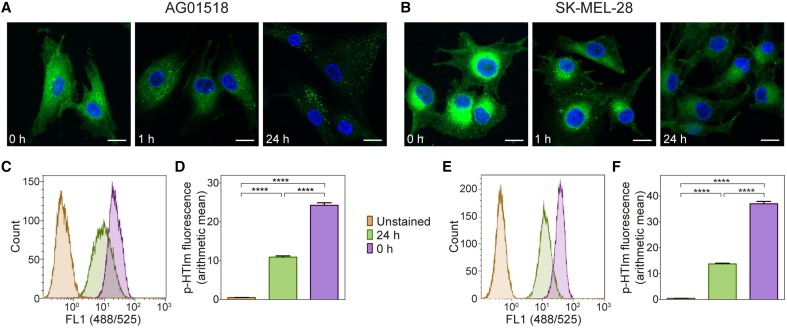
Kinetic studies of p-HTIm staining. Fluorescence images of (A) human fibroblasts (AG01518) and (B) melanoma cells (SK-MEL-28) stained with p-HTIm (5 μM, 30 min; green) and incubated in fresh medium for indicated periods of time. Cell nuclei were labeled with DAPI (blue). Scale bars 20 μm. Histograms of fluorescence intensity from flow cytometry analysis of (C) human fibroblasts and (E) melanoma cells stained with p-HTIm as described above. Graphs of arithmetic mean fluorescence intensity of (D) human fibroblasts (calculated from C) and (F) melanoma cells (calculated from E), n = 4. Significant differences were determined by one-way ANOVA with Bonferroni post-hoc test, ****p ≤ 0.0001.

