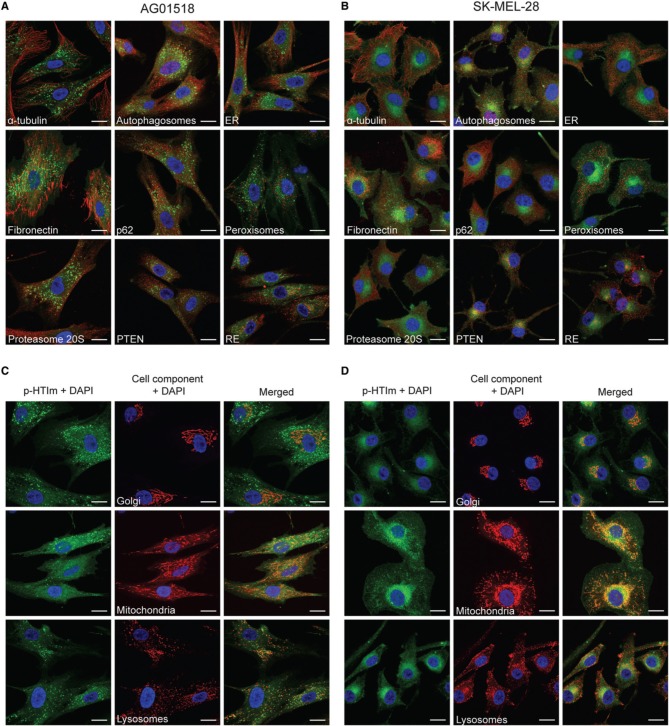
Figure 4.
Intracellular targets of p-HTIm. Merged fluorescence images of (A,C) human fibroblasts (AG01518) and (B,D) melanoma cells (SK-MEL-28) stained with p-HTIm (5 μM, 30 min; green) and incubated in fresh medium for 24 h. The cells were stained with fluorescent markers against α-tubulin, autophagosomes (LC3), ER (calnexin), fibronectin, p62, peroxisomes (PMP70), proteasome 20S, PTEN, recycling endosomes (rab11a), Golgi (Golga2), mitochondria (mitotracker), and lysosomes (LAMP-2) (red). Cell nuclei were labeled with DAPI (blue). The color channels are split in (C) and (D) to improve the visualization. Scale bars 20 μm.

